
Date: Mon, Dec 29, 2025 | 06:36 AM GMT
The broader cryptocurrency market has kicked off the final week of 2025 with modest strength, as Bitcoin (BTC) reclaimed the $90,000 mark while Ethereum (ETH) trades over 3% higher. This improving backdrop has helped stabilize market sentiment, allowing notable altcoins — including Aptos (APT)— to begin forming constructive technical structures.
APT is trading with a modest intraday gain, but more importantly, its daily chart is now signaling a meaningful structural shift — one that could mark the early stages of a bullish continuation if confirmed.

Source: Coinmarketcap
Rounding Bottom in Play
On the daily timeframe, Aptos appears to be shaping a textbook rounding bottom formation — a classic bullish reversal pattern that typically emerges after an extended period of downside pressure. This structure reflects a gradual transition from distribution to accumulation, where sellers lose control and buyers quietly begin to step in.
APT previously faced strong rejection near the $3.08 neckline zone before entering a sharp decline that eventually bottomed out near $1.42. This area acted as a critical demand zone, where price repeatedly found support, preventing any deeper breakdown and laying the groundwork for a potential trend reversal.
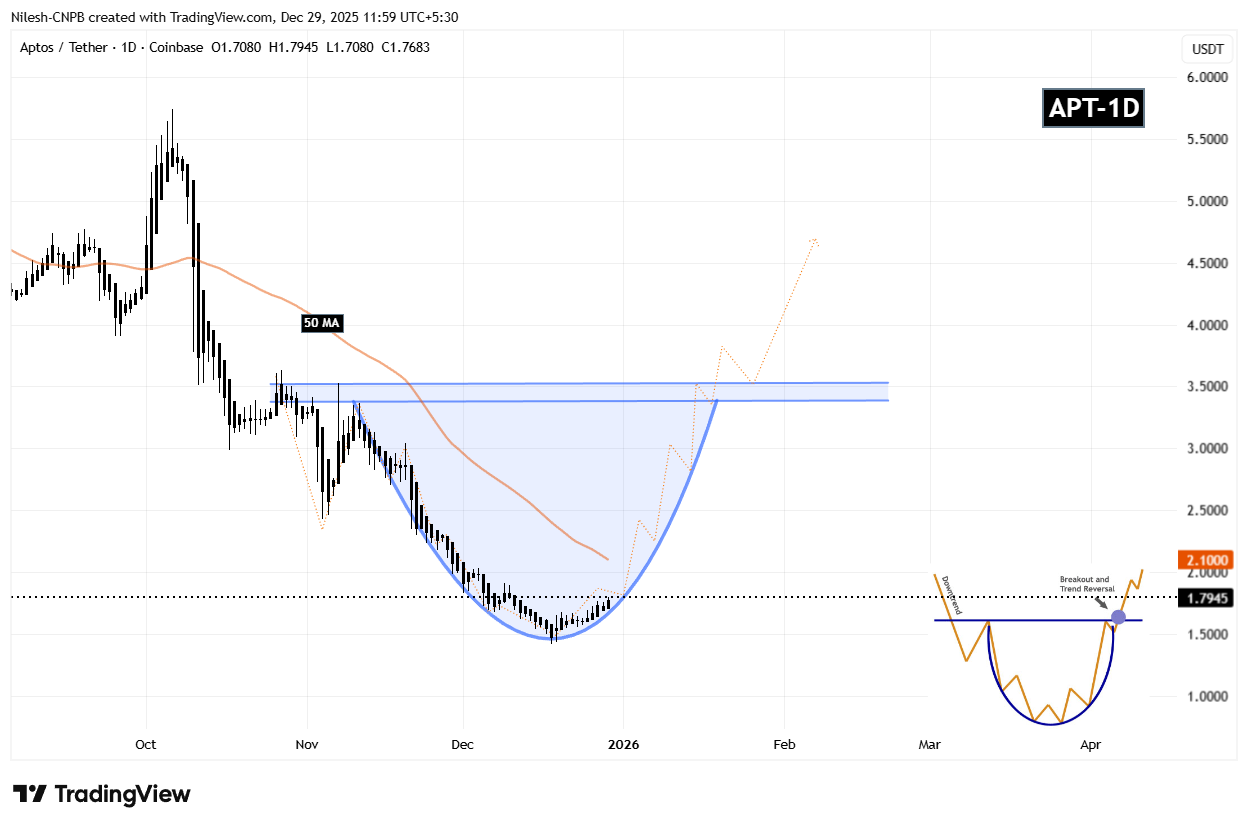
Aptos (APT) Daily Chart/Coinsprobe (Source: Tradingview)
Since establishing that base, APT has begun curving higher in a rounded fashion, signaling that selling pressure is fading. The steady recovery back toward the $1.79 region suggests that accumulation is underway and that the market is slowly preparing for a larger move.
What’s Next for APT?
For the rounding bottom pattern to fully activate, APT must reclaim the 50-day moving average, currently positioned near $2.10. A decisive move above this level would mark a key momentum shift, confirming that buyers are regaining control after months of corrective price action.
Beyond that, the major technical hurdle remains the neckline resistance around $3.08. A clean breakout above this zone would validate the entire reversal structure and could open the door for a broader bullish expansion phase, with momentum traders likely re-entering the market.
Until those levels are reclaimed, the pattern remains in development. Short-term pullbacks or consolidation are still possible if APT struggles at the 50-day MA, but as long as price continues to hold higher lows above the $1.42 base, the broader bottoming structure remains intact.
Overall, Aptos is approaching a technically important inflection point. The rounding bottom formation, improving structure, and proximity to key resistance levels suggest the coming sessions could prove decisive for the token’s next directional move.
Disclaimer: The views and analysis presented in this article are for informational purposes only and reflect the author’s perspective, not financial advice. Technical patterns and indicators discussed are subject to market volatility and may or may not yield the anticipated results. Investors are advised to exercise caution, conduct independent research, and make decisions aligned with their individual risk tolerance.
About Author: Nilesh Hembade is the Founder and Lead Author of Coinsprobe, with over 5 years of experience in the cryptocurrency and blockchain industry. Since launching Coinsprobe in 2023, he has been providing daily, research-driven insights through in-depth market analysis, on-chain data, and technical research.

Disclaimer: The information on this page may come from third parties and does not represent the views or opinions of Gate. The content displayed on this page is for reference only and does not constitute any financial, investment, or legal advice. Gate does not guarantee the accuracy or completeness of the information and shall not be liable for any losses arising from the use of this information. Virtual asset investments carry high risks and are subject to significant price volatility. You may lose all of your invested principal. Please fully understand the relevant risks and make prudent decisions based on your own financial situation and risk tolerance. For details, please refer to
Disclaimer.
Related Articles
Bitcoin ETFs Shed Nearly $300M as Risk-Off Pressure Builds Across Markets
U.S. spot Bitcoin ETFs experienced approximately $296 million in net outflows from March 24 to March 27 due to growing market risk aversion amidst geopolitical and macroeconomic pressures, indicating broader investor de-risking trends.
CryptoNewsFlash15m ago
XRP Price News: On-Chain Outflows Surge, Possibly Signaling Potential Demand; XRP’s April Average Return Rate Is About 24.8%
XRP has been weak over the past 24 hours, falling more than 2%. Despite the short-term pullback, its on-chain activity and withdrawal transaction volume have rebounded, suggesting investors’ long-term willingness to hold the asset. Analysis indicates that seasonal factors may present an opportunity for XRP to move higher, and traders should monitor outflow transaction dynamics to gauge its future direction.
GateNews16m ago
Bitcoin Floor Models Point to a Potential Bottom Near $46K as Capital Weakens
Bitcoin's onchain models indicate a potential bottom between $46,000 and $54, according to analyst Willy Woo. While historical support remains, declining capital raises concerns about the model's reliability amid changing market conditions.
CryptoNewsFlash19m ago
17.83% Plunge for TWT: What Traders Should Know
Trust Wallet Token (TWT) experienced a rapid 17.83% drop in just 15 minutes, reflecting broader market volatility. With trading volume at $4 million and mixed market signals, traders are monitoring key support and resistance levels for future direction.
Coinfomania31m ago
The Bitcoin Fear and Greed Index has fallen to 8, hitting a new low for the current cycle, with fear persisting for nearly 60 days. When will the market bottom out?
Bitcoin market sentiment remains depressed, and the Fear and Greed Index has fallen to 8. It has been at extreme fear for 59 days, mainly driven by high interest rates and the global economic environment. Despite retail traders’ low sentiment, long-term holders are still transferring assets. The market faces structural disagreement, and future price action will depend on changes in macro liquidity.
GateNews37m ago
Trump speaks out, combined with Iran calling for more, and the S&P 500 surged by $90 billion overnight
By the end of March 2026, due to remarks by Iran’s parliamentary speaker and comments by Trump that influenced the U.S. stock market sentiment, the U.S. stock market experienced volatility, and the S&P 500’s market capitalization rebounded by approximately $900 billion in the short term. The market is highly sensitive and responds noticeably to political statements. Despite the stock market rebound, oil prices remain high, and ongoing geopolitical impacts continue to attract investor attention; the future market trend will depend on the progress of negotiations.
GateNews38m ago
