
Date: Thu, Jan 01, 2026 | 10:30 AM GMT
As the new year 2026 begins, the broader cryptocurrency market is showing modest weakness, with both Bitcoin (BTC) and Ethereum (ETH) trading slightly in the red. This soft start has weighed on sentiment across the altcoin space as well, including Monad (MON). However, beneath the surface, MON’s chart structure is beginning to tell a more constructive story.
MON is currently down around 4% on the day, extending its 60-day decline to roughly 21%. While short-term price action remains subdued, the more important signal is emerging on the daily chart, where price structure is beginning to hint at a meaningful shift. If confirmed, this setup could mark the early stages of a bullish continuation following a prolonged corrective phase.
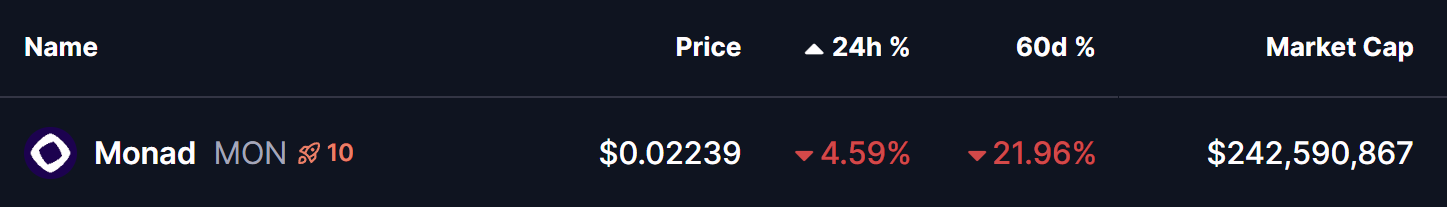
Source: Coinmarketcap
Rounding Bottom in Play
On the daily timeframe, MON appears to be forming a textbook rounding bottom pattern — a classic bullish reversal structure that typically develops after extended downside pressure. This pattern reflects a gradual transition from distribution to accumulation, where selling momentum weakens and buyers begin to step in more consistently.
Previously, MON faced strong rejection near the $0.04923 neckline zone, triggering a sharp decline that unfolded through late November and December. That move eventually found a floor near the $0.017 level, which has since acted as a key demand zone. Repeated defenses of this area prevented any deeper breakdown and helped establish a stable base for a potential trend reversal.
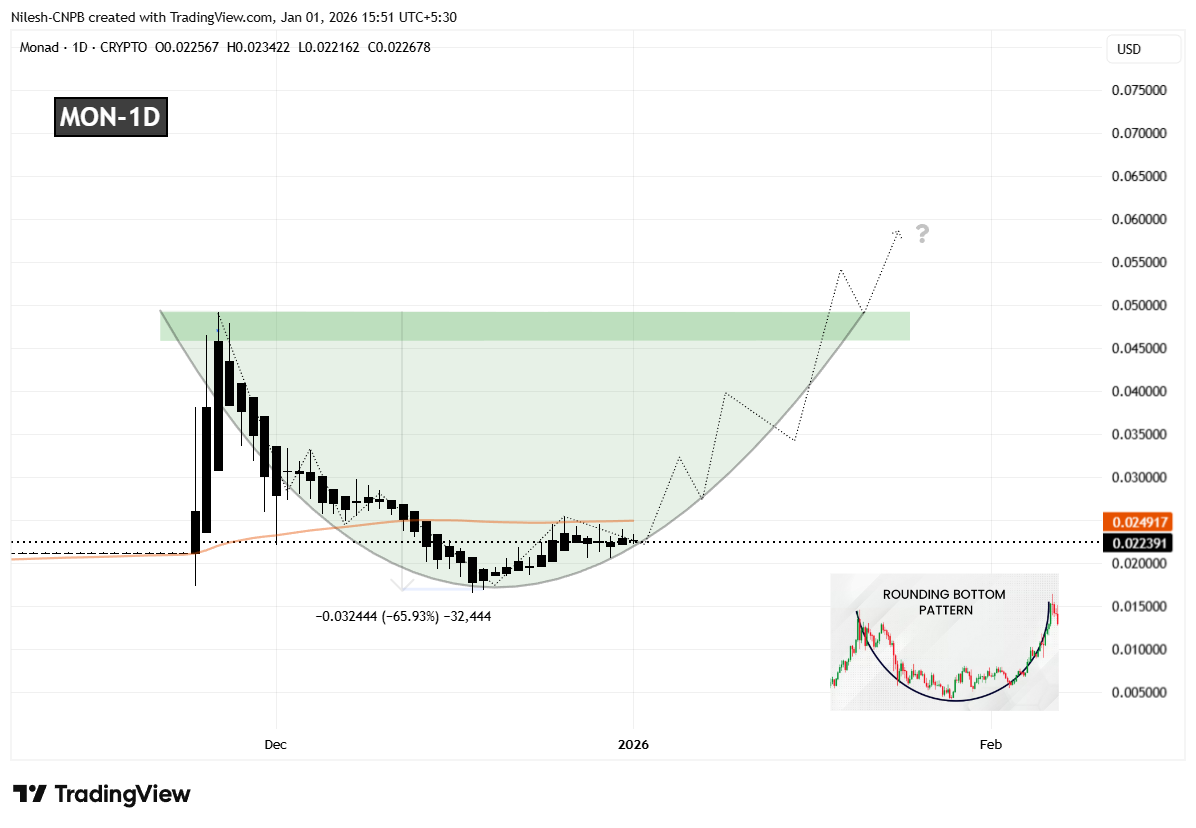
Monad (MON) Daily Chart/Coinsprobe (Source: Tradingview)
Since forming that bottom, MON has started to curve higher in a rounded fashion, closely matching the classic structure of a developing bottoming pattern. This gradual recovery suggests that selling pressure is fading rather than accelerating. The recent stabilization and recovery back above the $0.022 region further indicate that accumulation may be taking place as the market quietly prepares for a larger move.
What’s Next for MON?
For the rounding bottom pattern to move into confirmation, MON needs to reclaim the 50-day moving average, currently positioned near the $0.02491 level. A sustained move above this area would signal a shift in short-term momentum and confirm that buyers are beginning to regain control after months of corrective price action.
Looking ahead, the most significant technical hurdle remains the neckline resistance around $0.04923. A clean and decisive breakout above this zone would validate the entire reversal structure and could open the door for a broader bullish expansion phase, with momentum traders likely returning to the market.
Until those levels are reclaimed, the pattern remains in its early development stage. Short-term pullbacks or consolidation remain possible if MON struggles near the 50-day moving average. However, as long as price continues to hold higher lows above the $0.017 base, the broader bottoming structure remains intact.
Overall, MON’s emerging rounding bottom formation suggests the token may be approaching an important inflection point. While confirmation is still pending, the improving structure and alignment with a classic bullish pattern indicate that the coming sessions could be decisive for Monad’s next directional move.
Disclaimer: The views and analysis presented in this article are for informational purposes only and reflect the author’s perspective, not financial advice. Technical patterns and indicators discussed are subject to market volatility and may or may not yield the anticipated results. Investors are advised to exercise caution, conduct independent research, and make decisions aligned with their individual risk tolerance.
About Author: Nilesh Hembade is the Founder and Lead Author of Coinsprobe, with over 5 years of experience in the cryptocurrency and blockchain industry. Since launching Coinsprobe in 2023, he has been providing daily, research-driven insights through in-depth market analysis, on-chain data, and technical research.

Disclaimer: The information on this page may come from third parties and does not represent the views or opinions of Gate. The content displayed on this page is for reference only and does not constitute any financial, investment, or legal advice. Gate does not guarantee the accuracy or completeness of the information and shall not be liable for any losses arising from the use of this information. Virtual asset investments carry high risks and are subject to significant price volatility. You may lose all of your invested principal. Please fully understand the relevant risks and make prudent decisions based on your own financial situation and risk tolerance. For details, please refer to
Disclaimer.
Related Articles
Midnight (NIGHT) Lands a $335M Bank Deal – And Cardano Is Being Asked Serious Questions
Midnight hasn’t even launched, and yet, they just pulled off something that most blockchains dream about. Monument Bank is going to tokenize retail customer deposits. In the first phase alone, that’s $335 million worth of real-world assets moving onto Midnight.
That’s more than the value of al
CaptainAltcoin25m ago
WSJ: The likelihood of a successful ceasefire between the US and Iran remains low; the 15-point plan was rejected, and Iran refuses to relinquish nuclear weapons and missiles.
The article states that Iran has not proactively requested the U.S. to suspend its energy strikes, contradicting Trump's claims. The ceasefire negotiations are progressing poorly, with Iran responding strongly to the U.S. proposal at 3 p.m., refusing to discuss nuclear weapons and missile issues. The passage of oil tankers through the Strait of Hormuz is seen as a symbolic progress, but there has been no substantial breakthrough. This situation affects the performance of risk assets like Bitcoin, and the OECD warns that if the conflict continues, U.S. inflation could rise.
動區BlockTempo40m ago
Ethereum Price News: ETH Breaks Above $2,400 as Three Key Indicators Show Signs of Recovery
Ethereum recently experienced a 6% pullback, retesting the $2,050 level, and the market remains cautious about whether it can rebound to $2,400. A breakout requires a revival in decentralized exchange activity, renewed institutional confidence, and futures market premiums returning to a reasonable range. Currently, Ethereum's price has fallen 31%, with weak market demand and limited short-term upward momentum. Investors should monitor on-chain data and capital flows.
GateNews44m ago
Michael Saylor: The next phase of Bitcoin is digital credit
MicroStrategy founder Michael Saylor proposes the concept of digital credit as a development direction for the cryptocurrency market. Using STRC preferred stock as an example, he emphasizes its low volatility and high yield characteristics. In Saylor's three-layer digital capital framework, digital credit aims to provide stable returns and bridge the gap in institutional crypto allocations, although it also faces critics' concerns about its sustainability.
MarketWhisper53m ago
JPMorgan: Bitcoin absorbs Iran war hedge funds, gold ETF experiences significant outflows
JPMorgan report indicates that due to the Iran conflict, Bitcoin outperformed gold and silver, the latter of which experienced significant declines due to rising interest rates and a strong dollar. Gold's high-position holdings were forcibly liquidated under market pressure, leading to capital outflows. Bitcoin remained stable, demonstrating its appeal as a safe-haven asset, especially amid geopolitical tensions. The report also emphasizes that Bitcoin's market liquidity has surpassed gold, indicating an improvement in its structural position.
MarketWhisper1h ago
Why did Bitcoin drop today? Trump extends Iran ceasefire period by 10 days, negotiations face disagreements.
U.S. President Trump extends the ceasefire period with Iran until April 6, but Iranian officials deny the request, leading to continued market pessimism about the prospects of negotiations. As the U.S. 10-year Treasury yield rises to 4.42%, the attractiveness of high-risk assets like Bitcoin diminishes, preventing a rebound and instead continuing to face selling pressure. The market is sensitive to liquidity conditions, and in the short term, attention should be paid to the direction of yields and spot demand.
MarketWhisper1h ago
