Date: Sun, Dec 21 2025 | 12:15 PM GMT
The broader cryptocurrency market is showing relative strength over the weekend, with both Bitcoin (BTC) and Ethereum (ETH) trading in the green. This stability in the majors has helped lift sentiment across the altcoin space, and Kaspa (KAS) is beginning to respond positively.
KAS is up more than 4% on the day, and more importantly, its recent price action is starting to outline a clear technical structure. The 4-hour chart suggests that a harmonic pattern is developing, hinting that KAS could be setting up for another upside attempt if key levels are reclaimed.
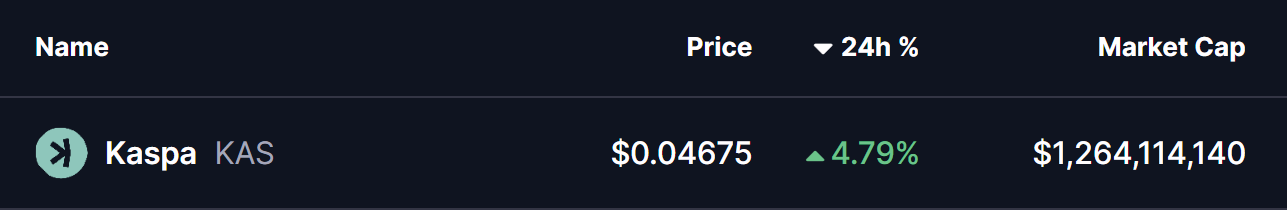
Source: Coinmarketcap
Harmonic Pattern Taking Shape
On the 4-hour timeframe, KAS appears to be forming a Bearish ABCD harmonic pattern. Despite the bearish label, this setup often delivers a strong bullish CD-leg before price reaches the Potential Reversal Zone (PRZ). This interim rally is typically the most aggressive phase of the structure, and that is the move currently unfolding.
The pattern began with a sharp advance from point A near $0.0360 to point B, marking KAS’s initial impulse higher. This was followed by a corrective pullback into point C around $0.0400, where downside momentum stalled and buyers stepped in decisively. The defense of this level suggests that selling pressure is weakening and that demand is beginning to build.
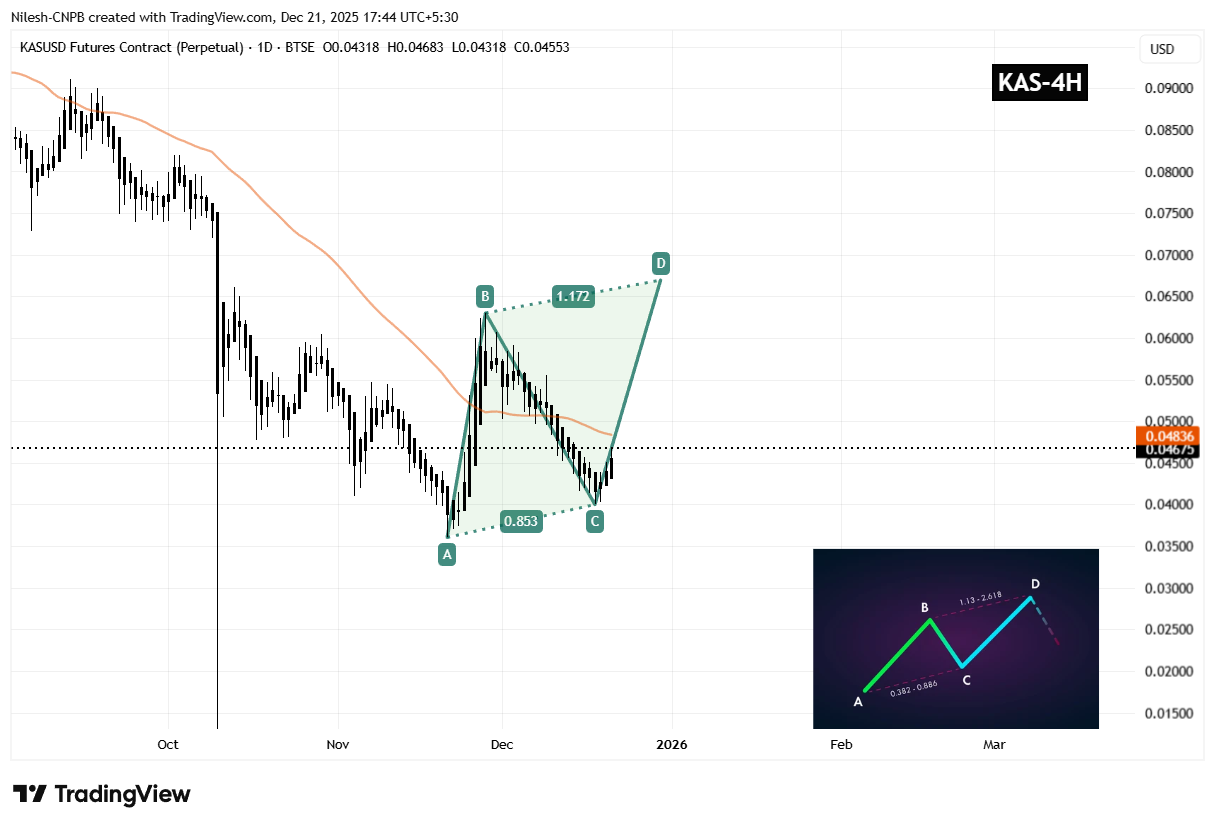
Kaspa (KAS) 4H Chart/Coinsprobe (Source: Tradingview)
Since bouncing from point C, KAS has pushed back toward the $0.046–$0.047 region, signaling the early stages of the CD-leg. This recovery phase indicates improving short-term momentum as the market tests overhead resistance.
A key technical obstacle now lies at the 50-period moving average, currently near $0.0484. This level has acted as dynamic resistance throughout the recent downtrend, and price is now compressing just below it. A clean breakout and sustained close above the 50 MA would be an important confirmation that bulls are regaining control and that the harmonic structure is progressing as expected.
What’s Next for KAS?
If buyers can drive KAS above the 50 MA and maintain momentum, the next upside objective aligns with the harmonic PRZ near the 1.17 Fibonacci extension around $0.0670. Reaching this zone would complete the ABCD pattern and represent a potential upside of roughly 40%–45% from current levels.
That said, the bullish scenario remains conditional. A failure to break above the 50 MA, followed by a drop back below the C-leg support near $0.0400, would weaken the harmonic setup and reopen the door for renewed bearish pressure.
For now, the structure on the chart suggests KAS is at a technically important inflection point. As long as price continues to hold above recent lows and challenge key resistance levels, the path of least resistance may remain tilted to the upside in the short term.
Disclaimer: The views and analysis presented in this article are for informational purposes only and reflect the author’s perspective, not financial advice. Technical patterns and indicators discussed are subject to market volatility and may or may not yield the anticipated results. Investors are advised to exercise caution, conduct independent research, and make decisions aligned with their individual risk tolerance.
Disclaimer: The information on this page may come from third parties and does not represent the views or opinions of Gate. The content displayed on this page is for reference only and does not constitute any financial, investment, or legal advice. Gate does not guarantee the accuracy or completeness of the information and shall not be liable for any losses arising from the use of this information. Virtual asset investments carry high risks and are subject to significant price volatility. You may lose all of your invested principal. Please fully understand the relevant risks and make prudent decisions based on your own financial situation and risk tolerance. For details, please refer to
Disclaimer.
Related Articles
Artificial Superintelligence Alliance (FET) makes a comeback thanks to the increasing flow of whale accumulation.
The Artificial Superintelligence Alliance (FET) has seen a significant recovery, maintaining above $0.230, supported by on-chain data and positive signals from the derivatives market. Whale accumulation and increased open interest highlight a bullish trend, with market sentiment favoring price growth.
TapChiBitcoin54m ago
Gold Plunges Below 4500! Stocks, Bonds, and Gold All Selling Off—Is Cash Really the Safe Haven King?
Gold has declined to $4,500 since late February 2026 due to geopolitical conflicts, with global capital markets in turmoil, the S&P 500 down 5%. U.S. Treasury yields are rising, safe-haven assets are underperforming, and capital flows into money market funds have reached historic highs, indicating a market preference for "cash is king." Bitcoin is experiencing volatility and has not yet established itself as a safe-haven asset.
ChainNewsAbmedia2h ago
Today the cryptocurrency fear and greed index rose to 12, with the market in a state of extreme panic.
Gate News Update: On March 21st, according to Alternative.me data, the Cryptocurrency Fear and Greed Index rose to 12 today (the index was 11 yesterday), with the market in an "extreme panic state."
GateNews2h ago
Canton (CC) Price in a Downtrend – Analyst Says the Drop Isn’t Over
Sometimes the market tells you exactly what it’s going to do. You just have to be paying attention. For Canton, the story has been pretty clear for a while now. Down, and then more down.
Sjuul from AltCryptoGems caught this one early. He spotted that bearish rejection just in time, and since t
CaptainAltcoin4h ago
BTC rises 0.52% in 15 minutes: Major capital net inflows to exchanges and multiple market resonance driving the move
2026-03-20 21:15 to 21:30 (UTC), BTC recorded +0.52% return in 15 minutes, with a price range of 70124.0 to 70586.6 USDT, and amplitude of 0.66%. This round of volatility occurred against a backdrop of increased market attention and heightened fluctuations, with both on-chain and market participants showing highly active behavior.
The main driver of this volatility was whale funds (entities holding >=1,000 BTC) making a net inflow of 4,091.39 BTC to exchanges within 24 hours, data significantly exceeding the average for the same period. Concentrated net inflows
GateNews5h ago
Bitcoin Has Stabilized, But Investors Are Paying Up for Downside Protection: VanEck
Bitcoin's volatility has decreased to around $70,000, but traders are still heavily investing in downside protection. Although premiums for puts have dropped, they remain high historically, suggesting caution among investors. This defensiveness may signal an impending price bottom, as similar market conditions in the past have led to recoveries.
Decrypt6h ago
