On Sunday, November 30, Monero (XMR) challenged the $440 resistance level. However, the previous downward momentum in the market created selling pressure on XMR.
Since this local peak, Monero has lost 10.6%, but it remains one of the few large-cap cryptocurrencies to maintain prospects for recent highs.
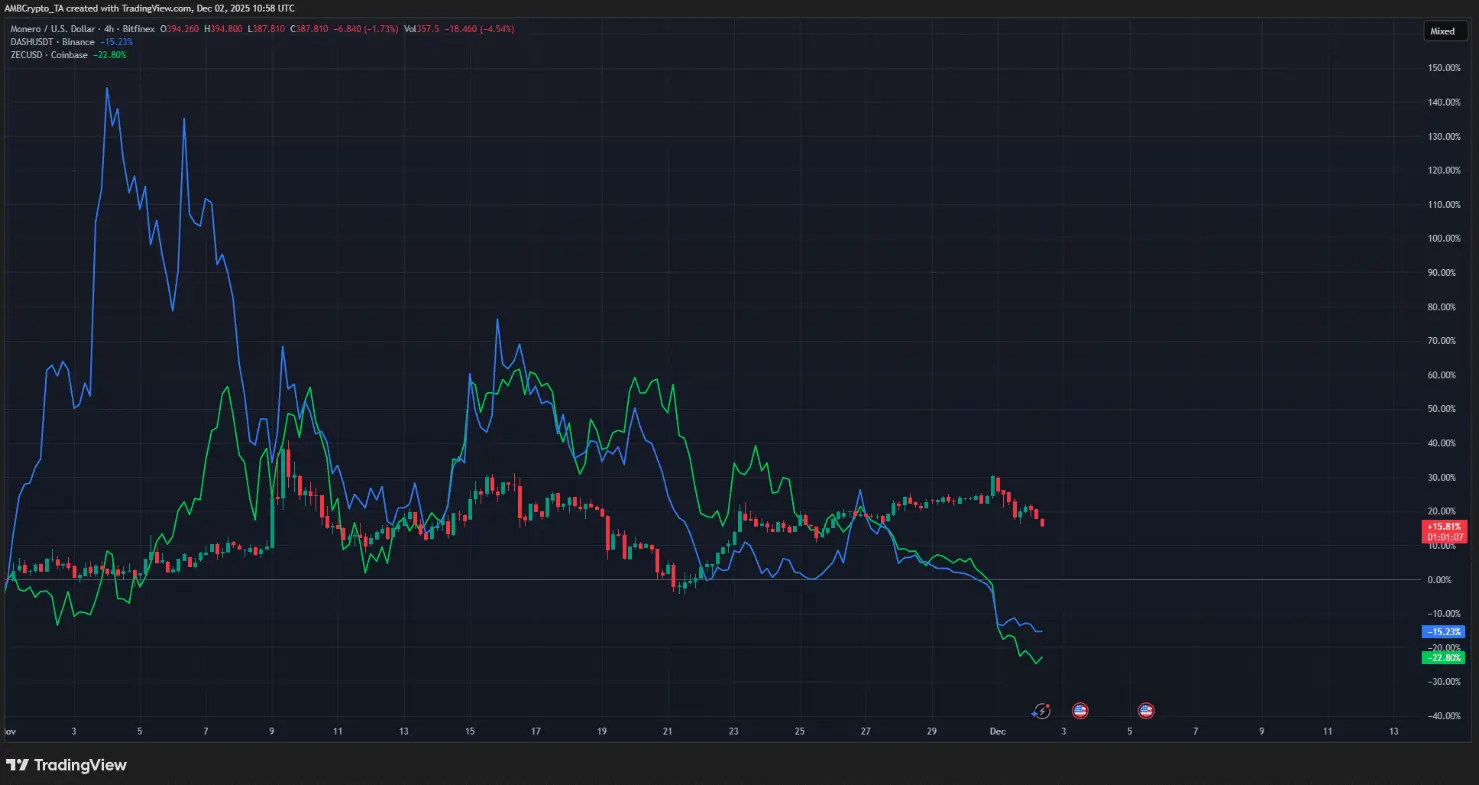 Source: TradingViewSince the beginning of November, XMR has increased by 15.8%, while the two other leading privacy coins, ZCash (ZEC) and Dash (DASH), have dropped by 22.52% and 15.23% respectively.
Although Monero has maintained stable performance in recent weeks, the long-term picture since September is still not particularly impressive: ZCash has surged 760%, while Monero has only modestly increased by 50.3%. However, with its relatively strong performance compared to the market in the past 10 days, the road ahead for XMR is opening up more opportunities for investors.
Monero trend remains positive
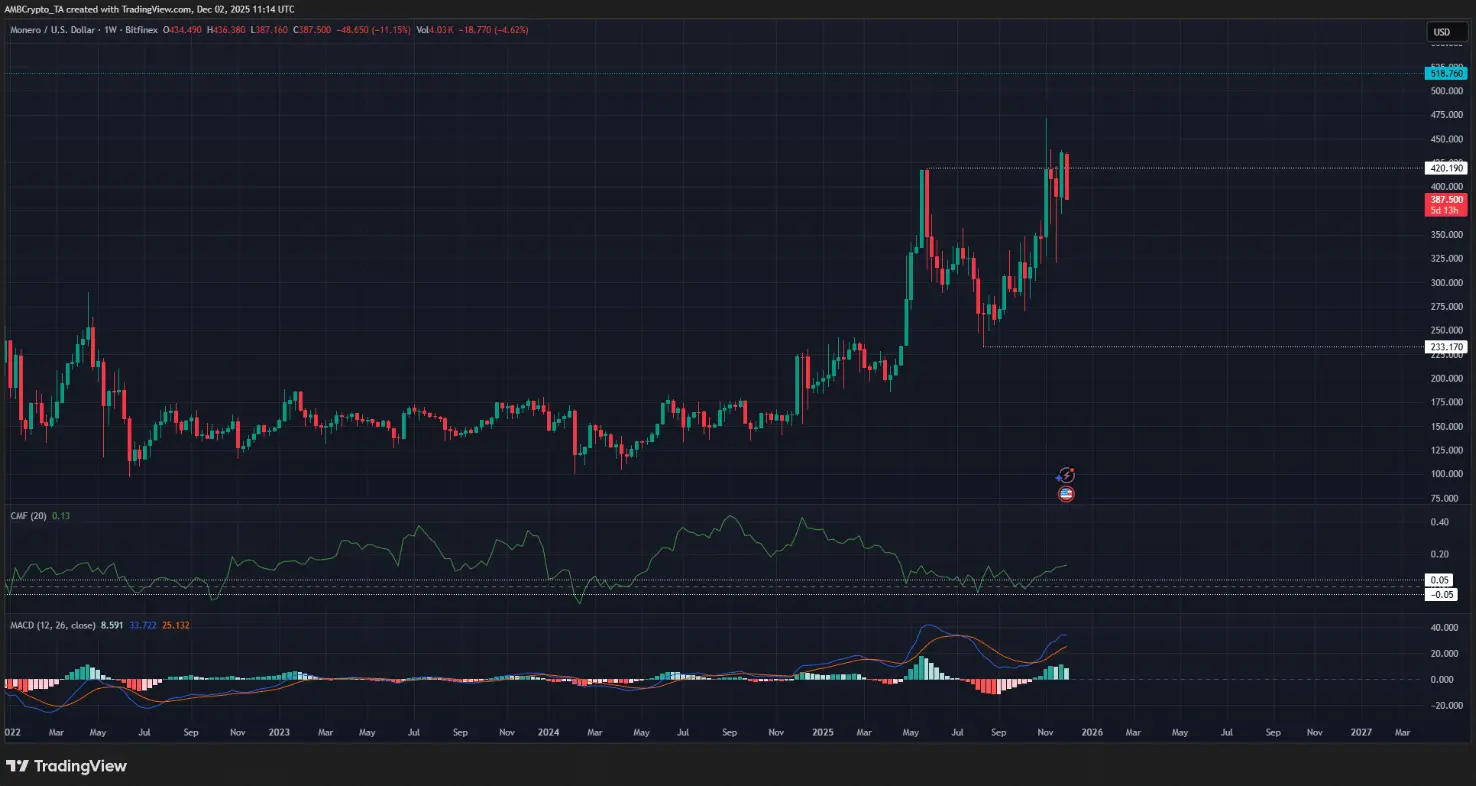 XMR/USDT weekly chart | Source: TradingViewOn the weekly timeframe, the previous peak at $420 has been broken, paving the way for a strong continuation of the uptrend. The next upside target is $518 —the all-time high from April 2021.
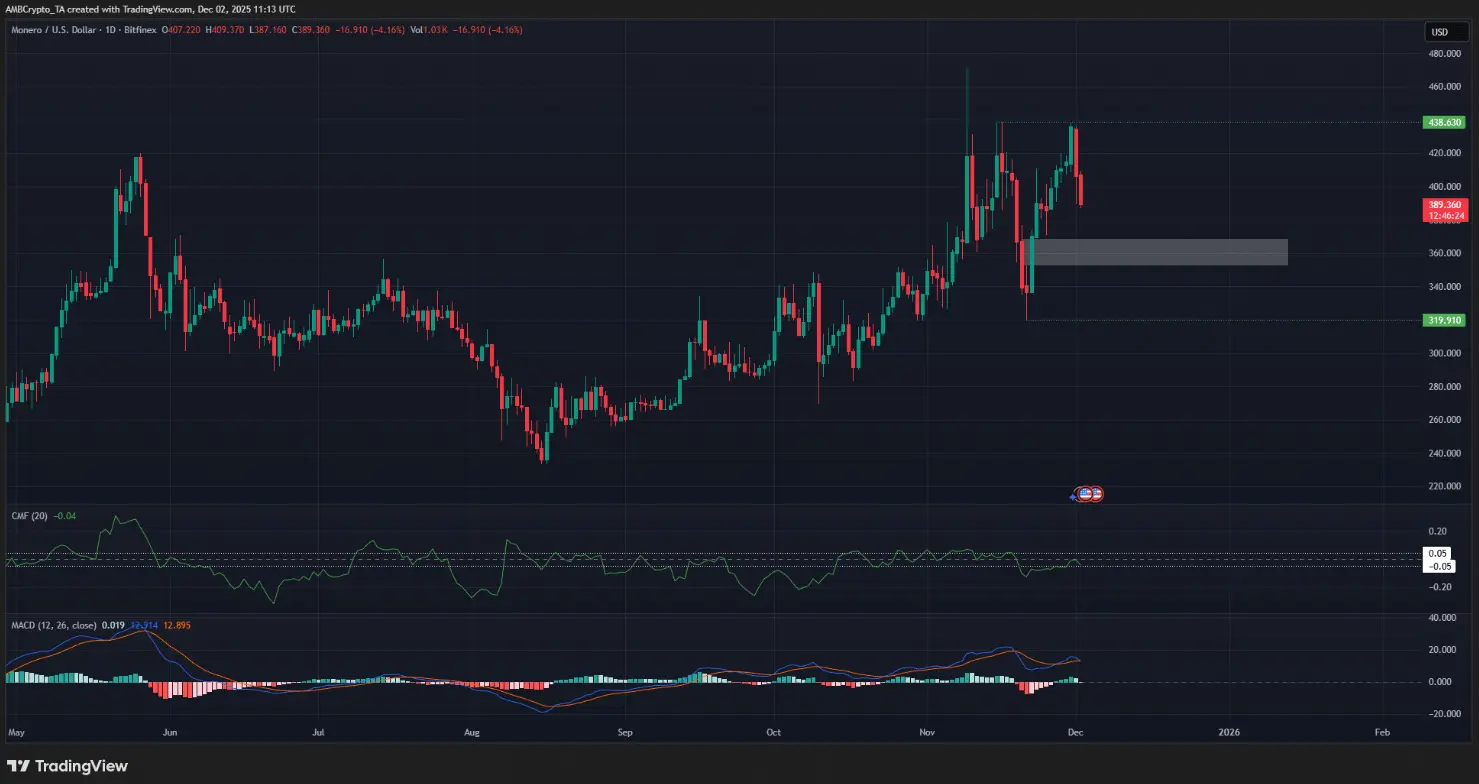 XMR/USDT daily chart | Source: TradingViewLooking at the daily chart, the swing structure still favors the bulls. The imbalance (white box) around $360 is expected to become a target in the coming days. However, the price rejection at $438 —the local peak in mid-November—is a mild warning, reminding bulls to remain cautious.
Understanding the indicators
The CMF indicator on the weekly chart records strong capital inflow, but on the daily chart, it reflects market hesitation. Similarly, the MACD shows noticeably stronger bullish momentum on the weekly timeframe compared to the daily.
 Source: CoinGlassThe liquidation map reveals that Long positions stopped out at $355 have higher total leverage compared to Short positions liquidated at $435.
This suggests that a downward move toward the $355–$360 region could occur in the short term. Conversely, above, investors should note a cluster of high-leverage Short positions concentrated around the $440–$450 area, which could create selling pressure if the price approaches this zone.
Assessing XMR’s bullish and bearish scenarios
The $233 and $320 levels serve as important support points that need to be maintained to uphold the trend. The imbalance on the daily chart, combined with signals from the liquidation map, suggests the risk of further price correction.
If a downturn occurs, the price is likely to hit the $350–$360 region, simultaneously opening an attractive buying opportunity for investors.
SN_Nour
Disclaimer: The information on this page may come from third parties and does not represent the views or opinions of Gate. The content displayed on this page is for reference only and does not constitute any financial, investment, or legal advice. Gate does not guarantee the accuracy or completeness of the information and shall not be liable for any losses arising from the use of this information. Virtual asset investments carry high risks and are subject to significant price volatility. You may lose all of your invested principal. Please fully understand the relevant risks and make prudent decisions based on your own financial situation and risk tolerance. For details, please refer to
Disclaimer.
Related Articles
Panic sentiment surges, "hedging costs" reach new highs! VanEck: Bitcoin may be approaching a reversal point
VanEck's research shows that the Bitcoin market is currently in a state of extreme anxiety. Despite rising hedging costs, traders are actively seeking downside protection. The report points out that while leverage and volatility have decreased, the options market is displaying panic signals, with put premiums reaching new highs. However, historical data suggests that extreme panic often precedes a rebound, and significant market turning points may emerge in the future.
区块客4m ago
TRUMP Token May Test Historical Lows Again? $70 Million Sell Pressure Incoming, $3 Level in Jeopardy
Trump token TRUMP has continued to decline recently, with the current price at $3.21, down 1.32% intraday and approaching its historical low of $2.705. On-chain data shows selling pressure has not been fully released, with significant major capital outflows. Technical analysis indicates that if the trend continues, the price could decline to $2.71, with $3.00 serving as psychological support. Market sentiment has turned cautious.
GateNews6m ago
MICA Daily | Why Have Stocks Fallen While Crypto Has Risen Recently? Analyzing the Truth Behind the Decoupling
Since October 2025, the positive correlation between Bitcoin and the S&P 500 Index has significantly weakened, entering a decoupling phase. This change stems from large-scale liquidation events, depressed market liquidity, and reduced risk appetite among traders. Meanwhile, ETF outflows and geopolitical tensions have also impacted Bitcoin's performance, demonstrating that its potential as a safe-haven asset is gradually increasing as deleveraging comes to an end.
区块客7m ago
Bitcoin Rebound Timeline Exposed: Scaramucci Says Q4 May Launch New Bull Market, $1 Million Target Unchanged
Under geopolitical risks and macroeconomic pressures, Bitcoin's price has broken below $68,000. Anthony Scaramucci, founder of SkyBridge Capital, believes this represents a typical cyclical pullback and anticipates Bitcoin may rally again in 2026. Despite short-term market risks, long-term bullish sentiment remains solid.
GateNews8m ago
Bitcoin Potentially Dips to $62,000? Mega Whales Counter-Trend Accumulation Hits One-Year High, Long-Short Battle Intensifies
Bitcoin broke below the head and shoulders neckline on March 23rd, with prices sliding to around $68,100. The downside target is expected at $62,200. Despite coin holders increasing positions and RSI forming a divergence signal, the market is still facing selling pressure. $69,500 serves as a key support level, and future trends will depend on the battle over key price levels.
GateNews12m ago
