EagleEye

vip
Age 1.7 Year
Peak Tier 5
Actions speak louder than words prove it by your actions
Pin
#WCTCTradingKingPK
🚨 Join My Team & Dominate WCTC S8 — Let’s Win Together 🏆🔥
This is not just another competition… this is WAR.
The WCTC S8 Trading Competition is now LIVE, and I am building a powerful team that is ready to rise, compete, and win big. 💪
I have already entered the arena with my team, and now I am inviting YOU to join me and become part of something bigger — a team that doesn’t just participate, but a team that dominates.
💥 Why join my team?
Because we are not here to play small. We are here to:
✔️ Build strong trading strategies together
✔️ Support each other in every tra
GT0.82%
post-image
post-image
post-image
post-image
post-image
post-image
post-image
post-image
  • Reward
  • 50
  • 1
  • Share
Luna_Star:
LFG 🔥
View More
🔹 Bio Protocol's multisignature wallet transferred 80 mi
64 views
2026-05-03 06:47
  • Reward
  • 5
  • Repost
  • Share
Luna_Star:
Diamond Hands 💎
View More
#GateSquareMayTradingShare
🔥📈⚡ MASTER THE MARKETS WITH PRECISION, DISCIPLINE & SIMPLICITY BUILD CONSISTENT TRADING EDGE FROM ZERO TO PRO LEVEL
Simple Strategies (Beginner Friendly Trading Guide)
Most people entering trading are beginners, and this is something that rarely gets addressed properly in most content. Many new traders believe that success requires complex indicators, advanced algorithms, or deep technical systems that only professionals can understand. In reality, most consistently profitable traders started with something much simpler. The real foundation of trading is not com
post-image
post-image
post-image
post-image
post-image
post-image
post-image
post-image
post-image
  • Reward
  • 8
  • Repost
  • Share
Crypto__iqraa:
2026 GOGOGO 👊
View More
#WCTCTradingKingPK
🏆 WCTCTradingKingPK You Have Been Invited, Join My Team NOW and Enter the S8 Trading Battlefield

🚨 You have been officially invited to join my WCTC S8 team
🔥 Hurry up — don’t delay, join my team before the competition becomes too intense
⚡ This is your entry point into a global trading battlefield where only active traders survive
🏁 Join now, participate, and compete with us as one unified squad
👉 https://www.gate.com/competition/wctc-s8?page=teamCompetition&ref=VLFDUVAOUQ&ref_type=165&teamId=52405&utm_cmp=qK2FsaYI
https://www.gate.com/competition/wctc-s8?page=teamC
post-image
post-image
post-image
post-image
post-image
post-image
post-image
post-image
post-image
  • Reward
  • 4
  • Repost
  • Share
Crypto__iqraa:
2026 GOGOGO 👊
View More
#USSeeksStrategicBitcoinReserve
🔥 US Strategic Bitcoin Reserve Narrative Emerges as Crypto Becomes a Geopolitical Asset Class in Global Power Competition
The confirmation from the U.S. Secretary of Defense that the United States is conducting covert operations aimed at securing a strategic advantage in Bitcoin marks a profound shift in how digital assets are being interpreted at the sovereign level. Alongside this, reports that the U.S. Department of the Treasury has seized nearly $500 million in Iranian crypto-linked assets further reinforces a broader trend: cryptocurrency is no longer onl
BTC-0.07%
post-image
post-image
post-image
post-image
post-image
post-image
post-image
post-image
post-image
  • Reward
  • 13
  • Repost
  • Share
Crypto__iqraa:
2026 GOGOGO 👊
View More
#BitcoinETFOptionLimitQuadruples
🔥 Bitcoin ETF Options Expansion BTC Impact & Price Structure Breakdown
The approval by the U.S. Securities and Exchange Commission to expand options limits on the iShares Bitcoin Trust from 250,000 to 1,000,000 contracts is a direct signal that Bitcoin’s market structure is moving into a deeper institutional derivatives regime.
This does not immediately change Bitcoin’s intrinsic value, but it changes how price behaves, where liquidity sits, and what drives volatility.
What is happening here is not a price event it is a market architecture event. It marks
BTC-0.07%
post-image
post-image
post-image
post-image
post-image
post-image
post-image
post-image
post-image
  • Reward
  • 11
  • 1
  • Share
Crypto__iqraa:
2026 GOGOGO 👊
View More
#FedHoldsRateButDividesDeepen
🔥 Fed Holds Rates but Deep Internal Split Signals Unstable Policy Path as Markets Reprice “Higher for Longer” Risk Across Global Assets
The latest decision from the Federal Reserve to maintain interest rates at 3.50%–3.75% for the third consecutive meeting initially appears to signal stability in monetary policy. On the surface, holding rates steady suggests a central bank in observation mode, waiting for clearer macroeconomic signals before making its next move. However, the deeper reality revealed through the voting structure tells a very different story — one
post-image
post-image
post-image
post-image
  • Reward
  • 9
  • Repost
  • Share
Luna_Star:
1000x VIbes 🤑
View More
#DeFiLossesTop600MInApril
🔥 DeFi Security Crisis Deepens as April Losses Surge Past $600M, Raising Structural Questions on Composability and Systemic Risk in Web3
The decentralized finance ecosystem is entering one of its most concerning security periods in recent history. In April alone, DeFi protocols experienced an estimated **$651 million in confirmed losses**, marking the highest monthly total since March 2022. This spike is not an isolated anomaly — it reflects a growing pattern of repeated exploits, systemic vulnerabilities, and increasingly sophisticated attack strategies targeting d
ARB-4.2%
post-image
post-image
post-image
post-image
  • Reward
  • 17
  • 1
  • Share
Luna_Star:
LFG 🔥
View More
#DailyPolymarketHotspot
🔥 DailyPolymarketHotspot AI Power Shift Case, Prediction Markets Signal Institutional-Grade Uncertainty Across Tech Regulation Future
Today’s spotlight on Polymarket centers around one of the most structurally important legal and technological narratives in modern AI history — the ongoing lawsuit involving Elon Musk and OpenAI, where the core dispute revolves around whether the organization deviated from its foundational “non-profit and open-source” mission by transitioning toward a commercially driven model.
This is not just a legal disagreement between founders and
post-image
post-image
post-image
post-image
  • Reward
  • 10
  • Repost
  • Share
Luna_Star:
DYOR 🤓
View More
#TapAndPayWithGateCard
🔥 Tap and Pay with Gate Card The Quiet Shift From Holding Crypto to Living With It
Gate Card represents something bigger than a payment tool. It represents a shift in how value is experienced in daily life. For most of financial history, money has existed in layers: what you earn, what you save, and what you spend are mentally and technically separated. Crypto initially added another layer on top of this system — powerful for storing value, but disconnected from everyday usability. What is changing now is not just the speed of transactions, but the collapse of those m
FLOW-0.71%
MOVE-0.56%
post-image
post-image
post-image
post-image
post-image
  • Reward
  • 13
  • Repost
  • Share
Luna_Star:
1000x VIbes 🤑
View More
#TreasuryYieldBreaks5PercentCryptoUnderPressure
🔥 Treasury Yields Hit 5 Percent as Liquidity Tightens and Crypto Markets Face Growing Pressure from Shifting Capital Flows
The recent move in the 30-year U.S. Treasury yield toward the **5 percent level** marks a significant moment in the current macro cycle. This is the highest level seen since July 2025, and it reflects a broader shift in how markets are pricing risk, inflation, and future monetary policy. While yields rising may appear to be just a bond market story, the implications extend far beyond fixed income and directly influence the
BTC-0.07%
post-image
post-image
post-image
post-image
post-image
post-image
post-image
post-image
  • Reward
  • 11
  • Repost
  • Share
Luna_Star:
To The Moon 🌕
View More
#OilBreaks110
🔥 Oil Shock Reshapes Global Markets as Brent Surge Triggers Inflation Fears, Policy Shifts, and Liquidity Repricing Ahead
The recent movement in Brent Crude Oil has introduced a significant shift in the broader financial landscape. Prices briefly surged above 141 dollars due to escalating tensions and disruption concerns around the Strait of Hormuz, before pulling back and stabilizing near 111.86. While the retracement may suggest temporary relief, the implications of that sharp spike continue to influence global markets in a meaningful way.
This type of price behavior is not j
post-image
post-image
post-image
post-image
post-image
post-image
post-image
post-image
post-image
  • Reward
  • 8
  • Repost
  • Share
Luna_Star:
To The Moon 🌕
View More
#BitcoinSpotVolumeNewLow
🔥 Bitcoin Volume Collapse Signals Massive Move Ahead as BTC Enters Silent Compression Phase Before Potential Explosive Breakout
Bitcoin is now moving through one of the most critical and deceptive phases the market can produce, and most participants still don’t fully understand what they’re looking at. On the surface, everything appears calm, controlled, almost lifeless. Price is holding steady, volatility has faded, and the urgency that once drove aggressive entries and exits has vanished. But that calm is not a sign of safety. It’s a sign of transition.
Daily spot
BTC-0.07%
post-image
post-image
post-image
post-image
post-image
post-image
post-image
  • Reward
  • 7
  • Repost
  • Share
Luna_Star:
To The Moon 🌕
View More
I've joined WCTC S8. Join me now to compete and share 8,000,000 USDT. Trade beyond limits and conquer the future. https://www.gate.com/competition/wctc-s8?page=teamCompetition&ref=VLFDUVAOUQ&ref_type=165&teamId=52405&utm_cmp=qK2FsaYI
post-image
  • Reward
  • 8
  • Repost
  • Share
Luna_Star:
LFG 🔥
View More
#BitcoinSpotVolumeNewLow Bitcoin Spot Volume Hits New Lows The Market Is Quiet, But the Pressure Is Building The Bitcoin market has entered one of its most important structural phases of 2026, and the strongest signal right now is not the price itself but the sharp collapse in spot market activity. As of May 2, 2026, Bitcoin continues trading around the $77,000–$78,500 zone, holding relatively stable after recovering from February’s heavy correction, but the deeper story is unfolding beneath the surface where trading participation has fallen to some of the weakest levels of this cycle. Rec
Yusfirah
#BitcoinSpotVolumeNewLow
Bitcoin Spot Volume Hits New Lows The Market Is Quiet, But the Pressure Is Building
The Bitcoin market has entered one of its most important structural phases of 2026, and the strongest signal right now is not the price itself but the sharp collapse in spot market activity. As of May 2, 2026, Bitcoin continues trading around the $77,000–$78,500 zone, holding relatively stable after recovering from February’s heavy correction, but the deeper story is unfolding beneath the surface where trading participation has fallen to some of the weakest levels of this cycle. Recent market reports show Bitcoin trading volume dropping below $8 billion on several sessions, reaching the lowest activity levels since late 2023, which confirms that the market is now operating under a major liquidity contraction phase rather than a strong expansion cycle.
What makes this phase so critical is that Bitcoin price has remained resilient despite participation collapsing. Usually, when volume falls this aggressively, price either weakens or becomes highly unstable. But Bitcoin is showing unusual equilibrium, suggesting that long-term holders are not distributing heavily while short-term speculative traders are reducing active participation. This creates a market where price remains compressed not because conviction is strong, but because neither buyers nor sellers are aggressive enough to force directional resolution.
The most recent market structure shows Bitcoin stabilizing after reclaiming the $75,000 zone, with immediate resistance building around $79,000 to $80,000. Multiple technical reports now confirm that while Bitcoin has recovered over 20% from February lows, the recovery has happened with weak spot participation and inconsistent capital inflows, meaning the move lacks the volume strength usually associated with sustainable bullish continuation. That divergence between price recovery and volume weakness is one of the strongest warning signs traders should be paying attention to right now.
The Real Meaning Behind Falling Spot Volume
Spot volume is real capital.
It reflects actual buying and selling of Bitcoin.
Unlike derivatives, which can create synthetic exposure and leveraged movement, spot volume represents real ownership transfer. When spot volume collapses, it means fewer real participants are engaging.
That matters because price strength without real capital participation becomes fragile.
The market becomes easier to manipulate.
Price discovery becomes weaker.
Volatility becomes more dangerous.
Recent industry reports show crypto exchange spot volume fell nearly 40% in Q1 2026, marking one of the steepest participation declines of the past two years. This wasn’t isolated to one exchange — it happened across the entire market structure, showing broad-based weakness in engagement.
This tells us something important:
Capital is not gone.
Capital is waiting.
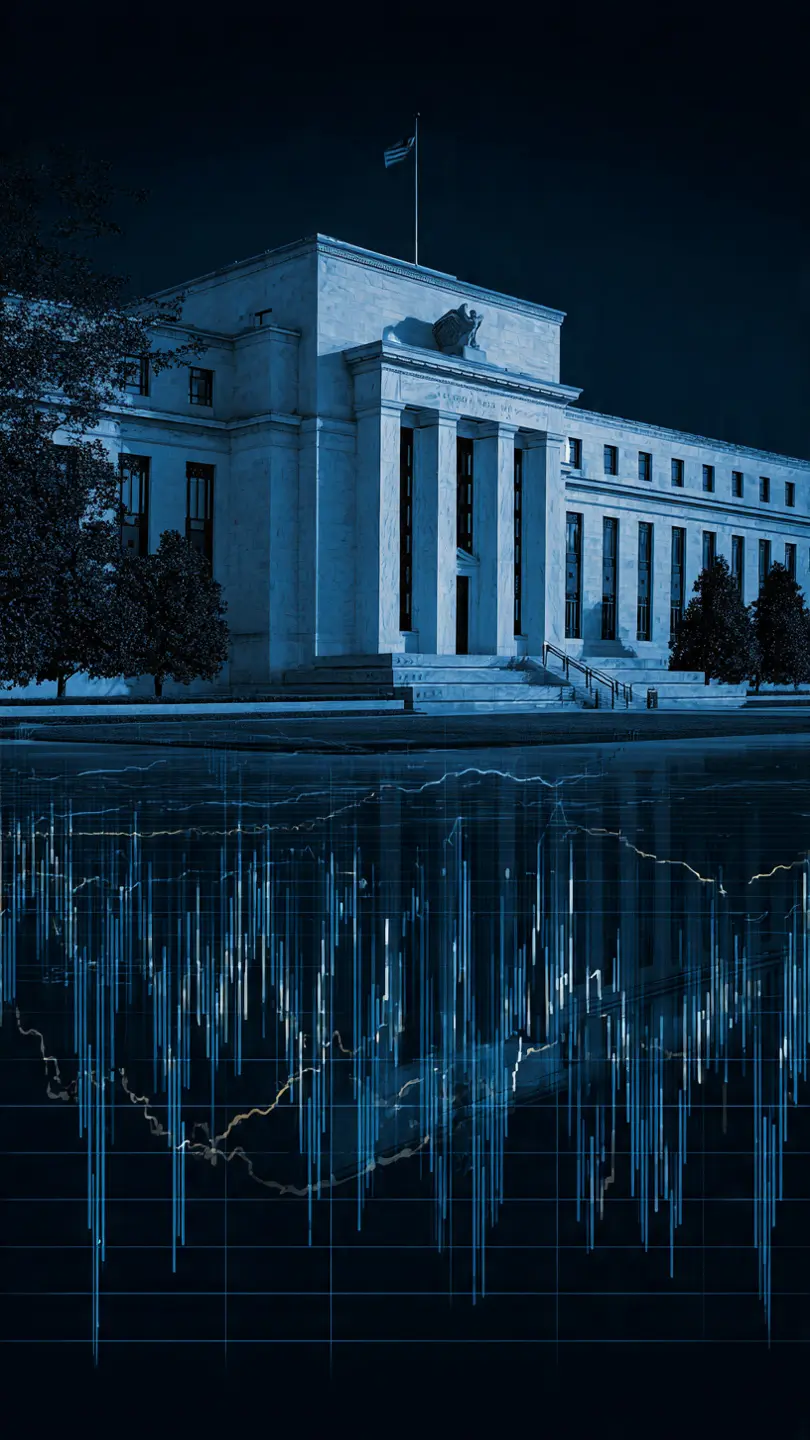
Why Traders Are Holding Back
The biggest reason behind low spot participation is macro uncertainty.
Bitcoin in 2026 is no longer trading like an isolated crypto asset.
It is trading like a macro-sensitive liquidity asset.
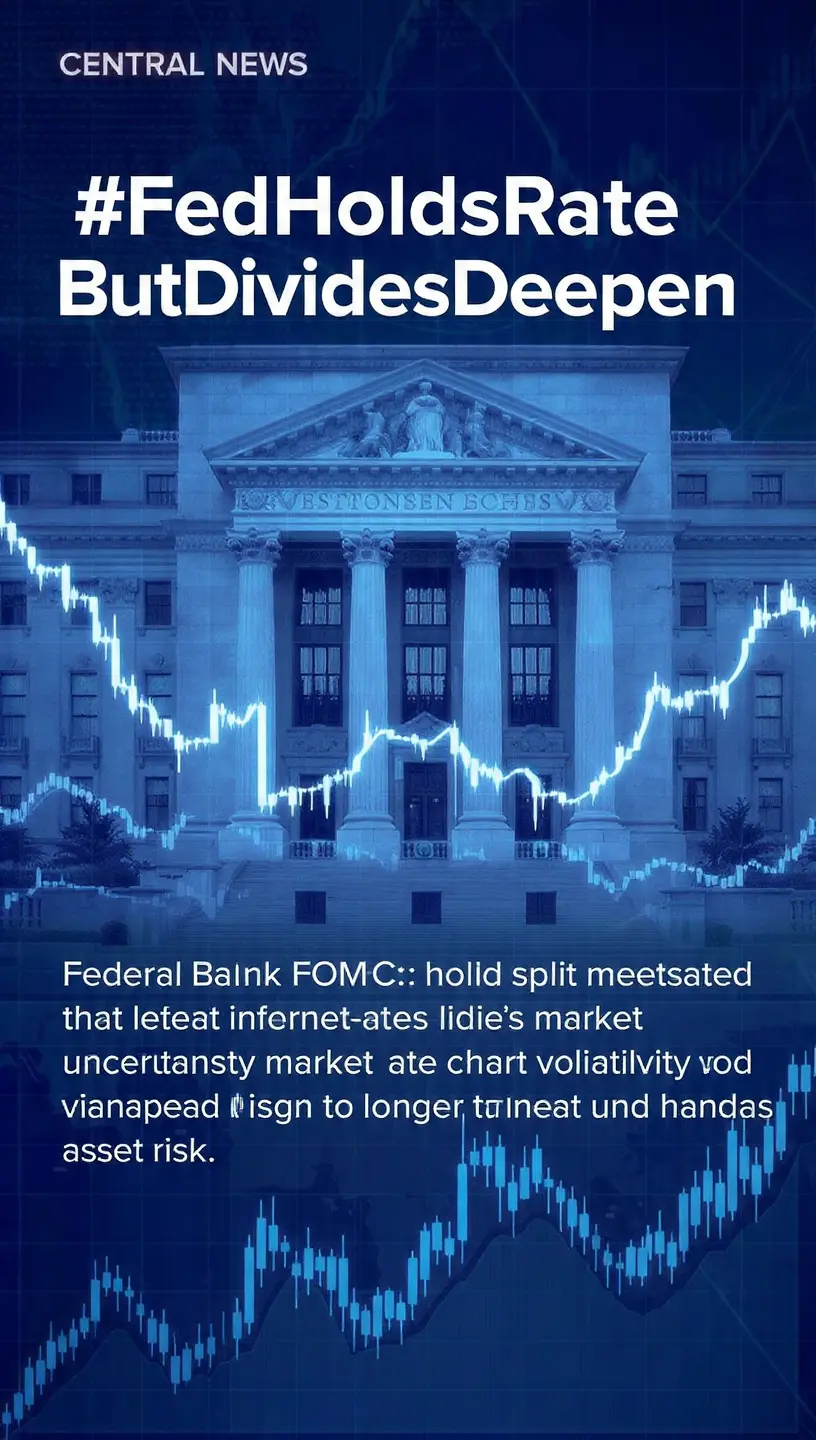
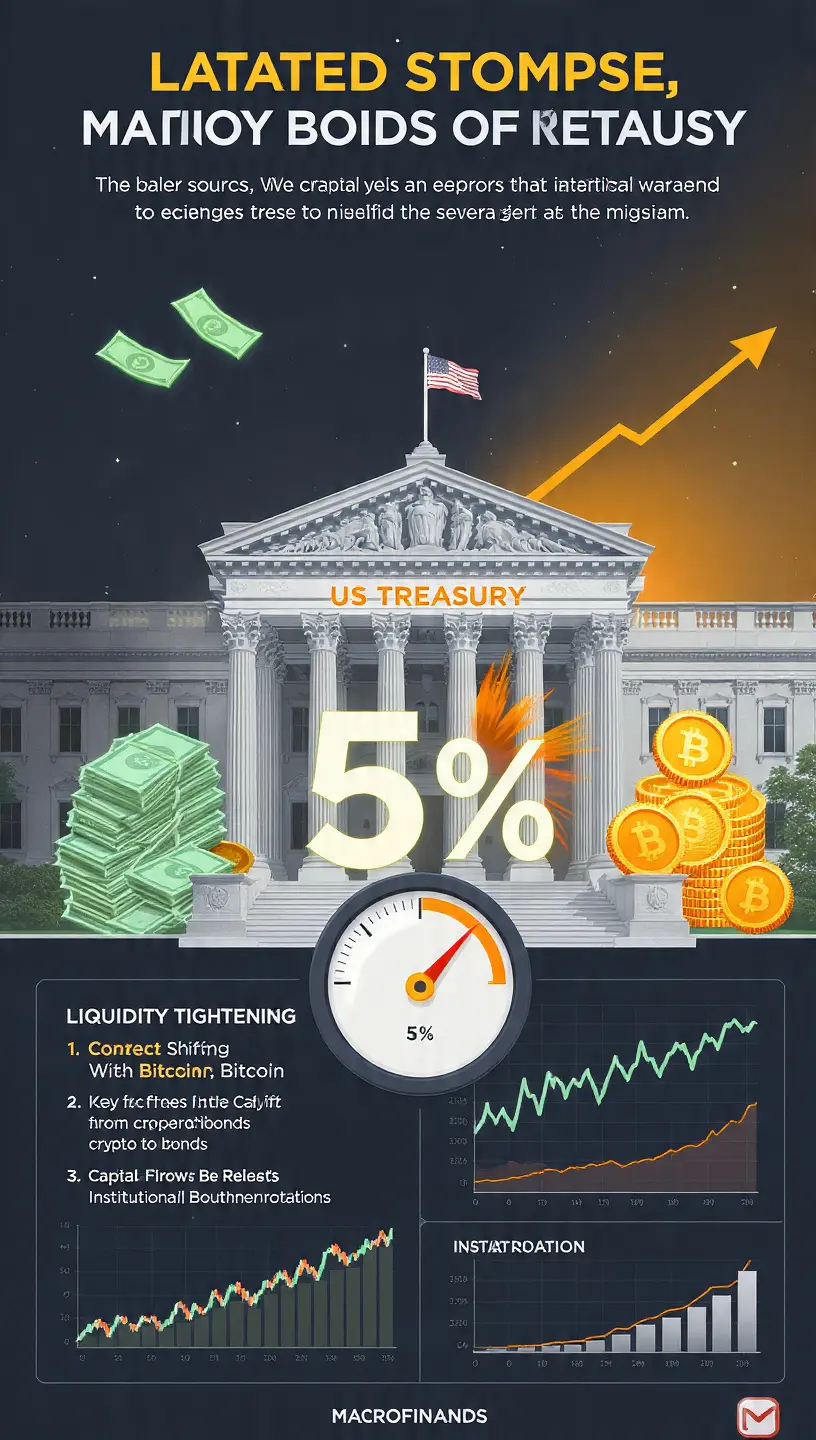
Interest rates remain elevated.
Inflation remains sticky.
Oil remains expensive.
The US dollar remains structurally strong.
All of these conditions reduce speculative capital deployment.
Risk assets perform best when liquidity expands.
Right now, liquidity remains tight.
This directly impacts Bitcoin.
The macro chain is clear:
High energy prices create inflation pressure.
Inflation keeps central banks restrictive.
Restrictive policy strengthens the dollar.
A stronger dollar reduces global liquidity.
Lower liquidity reduces Bitcoin participation.
That is exactly what we are seeing.
This is why traders are sitting in stablecoins.
This is why institutions are deploying slower.
This is why spot volume continues to weaken.
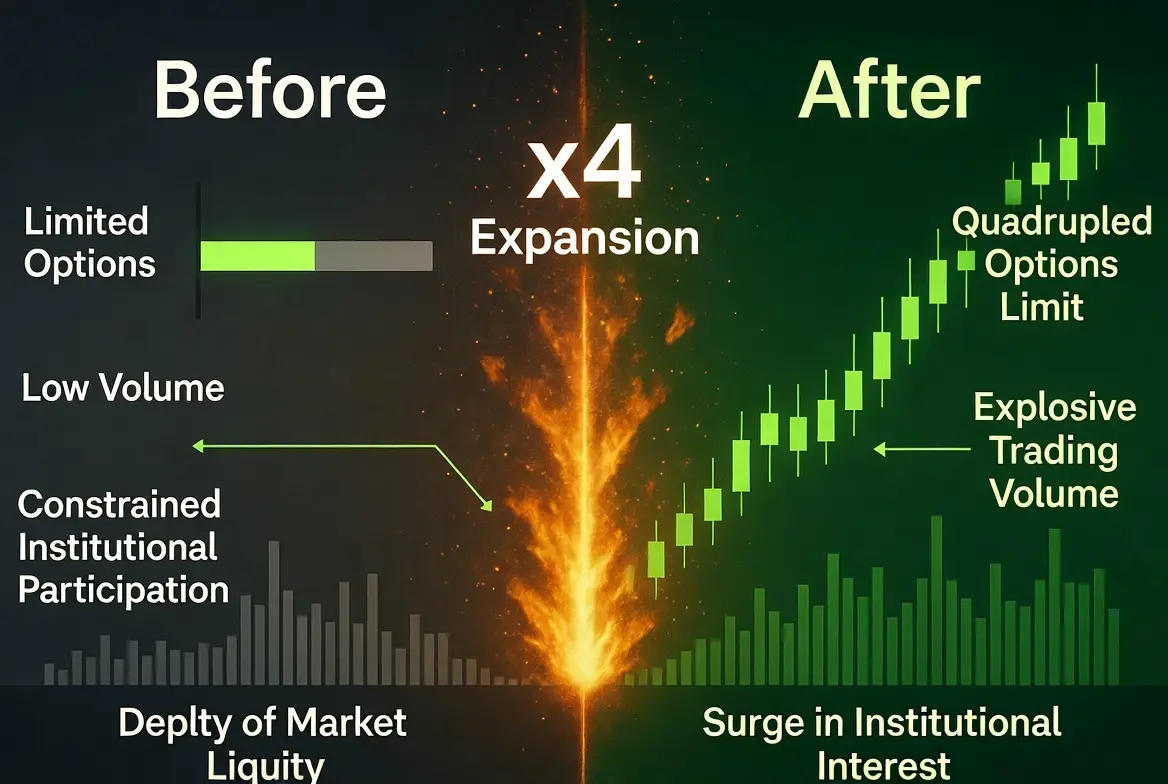
The Derivatives Shift Is Changing Market Structure
One of the biggest hidden shifts in Bitcoin this year is the migration from spot to derivatives.
Perpetual futures volume remains active.
Open interest is rising.
Options markets remain aggressive.
But spot activity is fading.
This creates a dangerous imbalance.
Because derivatives can move price fast.
But they cannot build long-term support.
That requires spot demand.
Right now, Bitcoin is increasingly being pushed by leveraged positioning instead of organic accumulation.
That means rallies can happen fast.
But they can reverse even faster.
Recent data shows futures open interest rising while spot activity remains historically weak, proving that leverage is increasingly replacing organic demand.
This is why every rally in this environment must be questioned.
Is it real buying?
Or leveraged chasing?
That difference matters.
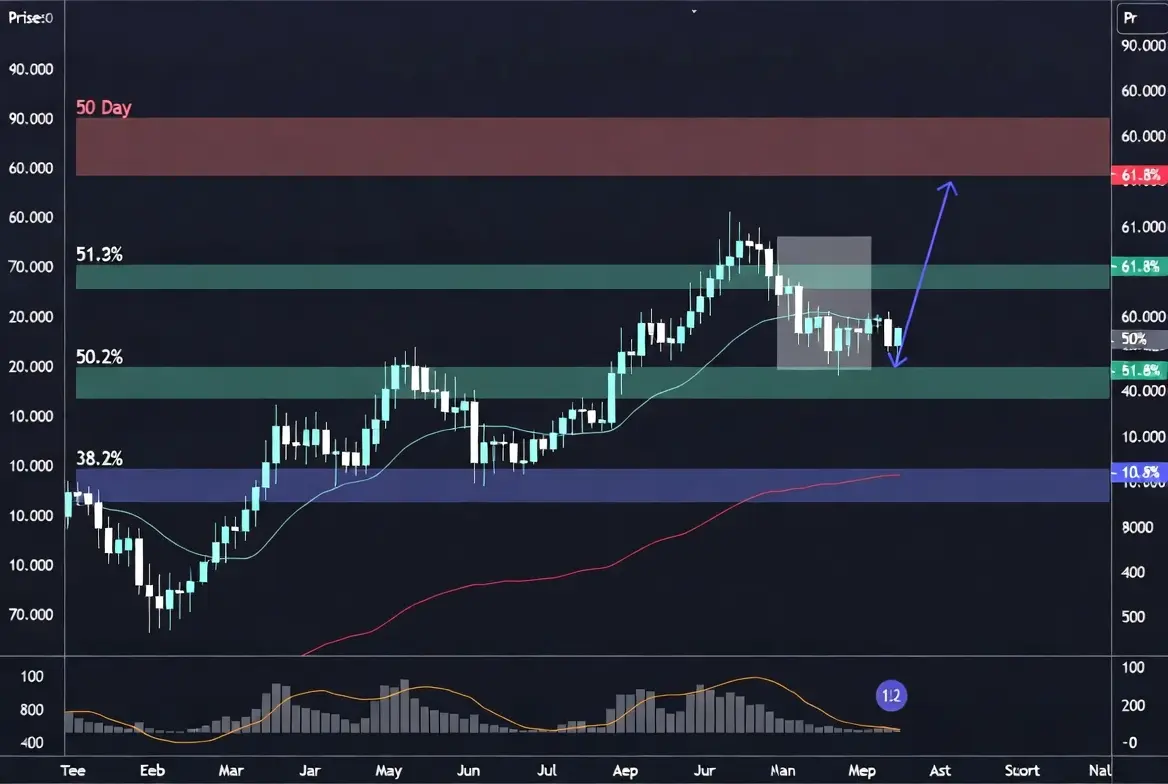
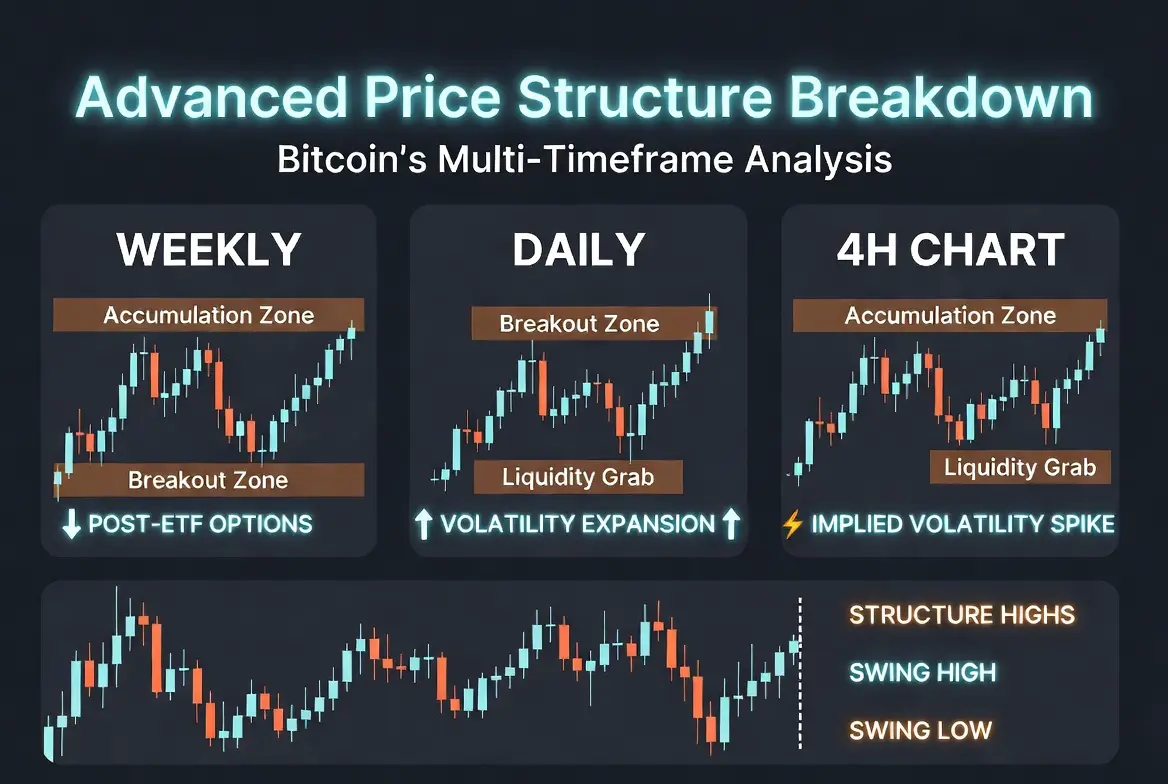
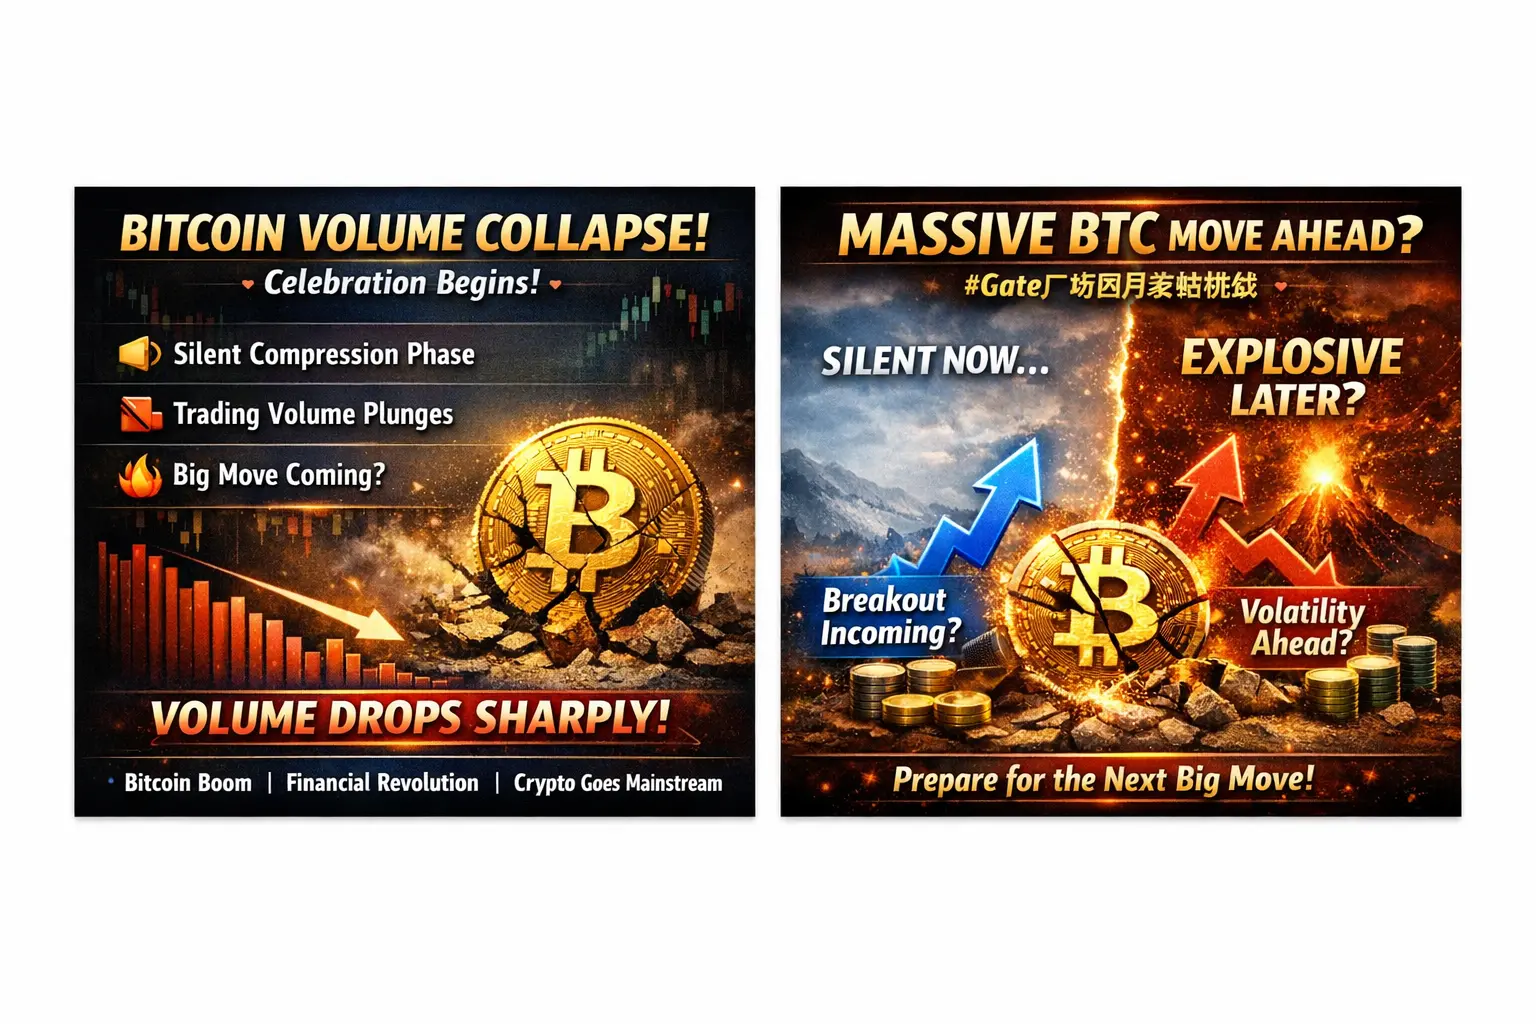
Bitcoin Is Entering a Compression Zone
The market right now is in what traders call compression.
Compression phases are powerful.
Because they store energy.
Price tightens.
Volume falls.
Volatility shrinks.
Participation weakens.
But the market keeps holding.
This creates pressure.
And pressure eventually releases.
Historically, Bitcoin does not stay in compression for long.
It expands.
Violently.
That expansion can go in either direction.
And low volume makes the move stronger because order books become thinner.
Reports now confirm exchange liquidity depth has weakened significantly, meaning moderate institutional orders now have larger price impact than before.
This means the next breakout may happen faster than most expect.
Bullish Scenario — The Return of Liquidity
The bullish case is simple.
If liquidity returns, Bitcoin moves higher.
What can bring liquidity back?
Rate cut expectations.
Cooling inflation.
Oil price stabilization.
ETF inflow acceleration.
Dollar weakness.
And institutional re-engagement.
ETF flows remain one of the strongest bullish variables right now. April saw nearly $2 billion in ETF inflows, showing institutions are still interested, even if spot traders remain cautious.
If spot participation improves by 30% to 50% from current levels, Bitcoin can break above the $80,000 barrier.
The first major upside target becomes $85,000.
Then $90,000.
A stronger expansion phase could push $95,000.
That would represent roughly 15% to 22% upside from current levels.
But volume must confirm.
Without volume, breakouts fail.
Bearish Scenario — If Participation Keeps Dying
The bearish risk is not immediate collapse.
The bearish risk is gradual weakness.
If spot activity remains weak and macro pressure continues, Bitcoin may lose the $75,000 support.
That opens the $72,000 zone.
Below that, $70,000 becomes critical.
If panic enters a thin liquidity market, the move can accelerate quickly.
Low-volume environments often create sharp liquidations.
Not because sellers are strong.
But because buyers are absent.
That distinction matters.
A market falls harder when nobody is willing to absorb.
That is the hidden risk right now.
My Personal Market View
My view is simple.
This is not a bearish market.
This is a waiting market.
The market is not weak.
It is undecided.
That is different.
The smart move right now is patience.
Not aggression.
I am watching four things very closely:
Spot volume recovery.
ETF inflow consistency.
Dollar strength.
Macro inflation pressure.
These four variables will decide Bitcoin’s next major move.
Until then, this remains a preparation phase.
Not a trend phase.
For traders, this is the phase to protect capital, reduce unnecessary leverage, and focus on structural zones.
Because when volume returns, Bitcoin will move fast.
And in low-liquidity environments, fast moves become violent moves.
Final Market Interpretation
Bitcoin’s spot volume collapse in May 2026 is not just a market statistic.
It is a structural warning.
A warning that liquidity is thin.
Participation is weak.
And price stability may be misleading.
But historically, these quiet phases often come before the strongest moves.
That is why this phase matters.
Because the market is storing energy.
And when that energy releases, Bitcoin could move 10% to 20% in a very short time.
Right now, Bitcoin is not trending.
It is compressing.
And compression is where smart money prepares before expansion.
The market is silent.
But the next move may be loud.
repost-content-media
  • Reward
  • 9
  • Repost
  • Share
Luna_Star:
Ape In 🚀
View More
📈 Institutions Just Got More Power The approval to expand options limits on iShares Bitcoin Trust ETF (IBIT) is a game-changing move: Position limit: 250,000 → 1,000,000 contracts More room for institutional positioning Strong signal of regulatory confidence 👉 Translation: Big money just got a bigger weapon 📊 What This Means for Bitcoin 1. Liquidity Explosion More options = more participation More participation = deeper markets 👉 Easier for institutions to enter and exit 2. Volatility Will Increase Options allow: Leverage Hedging Complex strategies 👉 Result: Sharper moves, both up and dow
BTC-0.07%
DragonFlyOfficial
🚨 #BitcoinETFOptionLimitQuadruples
📈 Institutions Just Got More Power
The approval to expand options limits on iShares Bitcoin Trust ETF (IBIT) is a game-changing move:
Position limit: 250,000 → 1,000,000 contracts
More room for institutional positioning
Strong signal of regulatory confidence
👉 Translation:
Big money just got a bigger weapon
📊 What This Means for Bitcoin
1. Liquidity Explosion
More options = more participation
More participation = deeper markets
👉 Easier for institutions to enter and exit
2. Volatility Will Increase
Options allow:
Leverage
Hedging
Complex strategies
👉 Result:
Sharper moves, both up and down
3. Smarter Market Structure
This isn’t retail-driven anymore.
Institutions now:
✔ Hedge positions
✔ Control risk
✔ Influence price flows
👉 Market becomes more engineered
⚔️ Hidden Risk Most Traders Ignore
More options doesn’t just mean opportunity.
It also means:
Gamma squeezes
Liquidation cascades
Fake breakouts
👉 Retail traders get trapped in volatility spikes
🧠 Smart Trading Approach
Adapt or get left behind:
✔ Focus on liquidity zones
✔ Avoid chasing breakouts
✔ Wait for confirmation
👉 Expect:
Manipulation before direction
⚠️ Risk Warning
Crypto markets are highly volatile, and increased institutional participation through options can amplify both gains and losses.
Always use proper risk management and avoid overexposure.
repost-content-media
  • Reward
  • 9
  • Repost
  • Share
Luna_Star:
Diamond Hands 💎
View More
#BitcoinSpotVolumeNewLow Bitcoin Spot Volume Hits Multi-Year Low: This Is Not “Calm”—It’s Liquidity Exhaustion When Bitcoin spot volume drops to ~$8B daily, the market is not “quiet.” It is starved of participation. That difference matters a lot more than most traders realize. Low volume is not neutral. It is a structural condition that changes how price behaves. 📉 What This Drop in Spot Volume Actually Means A fall to the lowest level since Oct 2023 signals: 🧊 Reduced real buyer interest in spot markets 💤 Institutions not actively accumulating at scale 🔄 Trading activity shifting t
BTC-0.07%
DragonFlyOfficial
#BitcoinSpotVolumeNewLow
Bitcoin Spot Volume Hits Multi-Year Low: This Is Not “Calm”—It’s Liquidity Exhaustion
When Bitcoin spot volume drops to ~$8B daily, the market is not “quiet.” It is starved of participation. That difference matters a lot more than most traders realize.
Low volume is not neutral. It is a structural condition that changes how price behaves.
📉 What This Drop in Spot Volume Actually Means
A fall to the lowest level since Oct 2023 signals:
🧊 Reduced real buyer interest in spot markets
💤 Institutions not actively accumulating at scale
🔄 Trading activity shifting toward derivatives, not spot
⚖️ Price discovery becoming thinner and more fragile
In simple terms:
There are fewer real buyers supporting price movement.
⚠️ Why Low Volume Is Dangerous (Not “Calm”)
Most retail traders misinterpret low volume as stability.
It is actually the opposite:
1. Thin Order Books = Sharp Moves
With fewer participants, even medium-sized orders can move price aggressively.
2. Fake Breakouts Become Common
Low liquidity allows price to “drift” into false directional moves.
3. Manipulation Becomes Easier
Whales don’t need large capital to move markets in low-volume conditions.
4. Trend Weakening
Sustainable trends require participation. Without it, momentum fades.
🧠 The Real Macro Interpretation
This is not just a Bitcoin issue — it reflects:
Reduced risk appetite in crypto markets
Capital rotation into yield assets (bonds, money markets)
Macro uncertainty limiting speculative flows
Traders waiting instead of committing
Combine this with higher yields and oil-driven inflation pressure, and you get:
A liquidity-constrained environment, not an accumulation phase.
₿ Why “Calm Before the Storm” Is Misleading
There are two possible interpretations people usually give:
❌ Bullish narrative:
“Low volume = accumulation before breakout”
⚠️ Reality check:
Accumulation normally shows:
steady inflows
rising spot activity
gradual volume expansion
What we are seeing instead is:
declining participation
weak spot demand
hesitation across market participants
That is not accumulation — that is absence of conviction.
📊 What Actually Drives the Next Big Move
Bitcoin does not move strongly from silence alone.
Big moves require:
📈 Liquidity expansion (new capital entering)
🔁 Derivatives leverage build-up or flush
🏦 Macro shift (rate expectations or USD weakening)
💰 Spot demand resurgence (ETF/institutional inflows)
Without these, price tends to:
Chop, drift, or compress further.
🧭 Current Market Structure Insight
Right now Bitcoin is sitting in a fragile combination:
Low spot volume 📉
Macro tightening pressure 🏦
High sensitivity to news shocks ⚡
Weak directional conviction 💤
This creates a market that is:
Easy to move, hard to trust, and dangerous to assume direction.
🧠 Strategic Insight (Dragon Fly Official Perspective)
From a structural viewpoint:
Dragon Fly Official interpretation:
This is not a “silent accumulation phase.” It is a liquidity vacuum phase, where both buyers and sellers are waiting for macro confirmation.
In these environments:
Breakouts are often false
Moves are driven by leverage, not conviction
Smart money waits for liquidity return, not price signals
The real opportunity does not come from predicting direction here — it comes from:
Waiting for volume to confirm intent before committing capital.
🔥 Key Takeaway
Low Bitcoin spot volume is not bullish or bearish by itself — it is a warning condition.
It tells you:
The market is fragile
Moves will be exaggerated
True direction is not yet confirmed
This is a decision-making phase, not a trading phase for aggressive positioning.
⚠️ Risk Warning
Low-liquidity crypto environments increase volatility risk, false breakout probability, and slippage during execution. Trading aggressively in low spot volume conditions without confirmation from macro and liquidity indicators significantly increases capital drawdown risk.
repost-content-media
  • Reward
  • 11
  • Repost
  • Share
Luna_Star:
LFG 🔥
View More
#WCTCTradingKingPK The Silent Setup Before the Next Explosive Move Market Overview and Current Positioning The market is currently in a critical phase where price action appears slow, but beneath the surface, a powerful setup is forming. Bitcoin is trading around 78,660, Ethereum is holding near 2,315, and Solana continues to maintain strength above the 80 region. This alignment across major assets reflects stability, not weakness. It shows that the market is holding structure while quietly preparing for its next directional move. This phase is often ignored by most traders because volatili
BTC-0.07%
ETH0.37%
SOL-0.48%
HighAmbition
#WCTCTradingKingPK
The Silent Setup Before the Next Explosive Move
Market Overview and Current Positioning
The market is currently in a critical phase where price action appears slow, but beneath the surface, a powerful setup is forming. Bitcoin is trading around 78,660, Ethereum is holding near 2,315, and Solana continues to maintain strength above the 80 region. This alignment across major assets reflects stability, not weakness. It shows that the market is holding structure while quietly preparing for its next directional move.
This phase is often ignored by most traders because volatility is low and there is no obvious trend. However, this is exactly where smart positioning happens. This is not the time to chase trades. This is the time to stay sharp, patient, and ready.
Market Structure and Compression Phase
The current structure is a textbook example of compression. Price is holding above key support levels while repeatedly testing resistance zones. This type of behavior indicates that sellers are losing strength while buyers are slowly building pressure.
Compression phases are extremely important because they act like a spring. The longer the market stays compressed, the stronger the eventual breakout tends to be. Bitcoin holding above its current range confirms that the trend is not broken. Ethereum stabilizing near 2.3K shows capital is still active, and Solana holding its level confirms that altcoins are not in a distribution phase.
This kind of alignment increases the probability that the next move will be expansion, but only after liquidity is fully built.
Liquidity Dynamics and Market Reality
The market does not move randomly. It moves toward liquidity. Right now, liquidity is positioned on both sides.
Above current Bitcoin price, there are breakout traders and short sellers whose stop losses can fuel an upward move. Below current levels, there are long positions with stop losses that can trigger a downside move.
This is why the market feels confusing. You see fake breakouts, sudden spikes, and quick reversals. These are not random moves. They are liquidity grabs designed to trap traders before the real move begins.
Understanding this gives you an edge. Instead of reacting emotionally, you start reading the intention behind price action.
Execution Strategy: Trade with Confirmation
A high-level trader does not predict blindly. The strategy is simple: react to confirmation.
If Bitcoin breaks above resistance with strength, the correct approach is to wait for a strong push, then a small pullback, and then continuation before entering. This confirms real momentum.
If the market drops below support, do not panic sell. Many breakdowns are traps. Let the move happen, watch for rejection, and only enter if the market shows signs of reversal.
If price stays within the current range, then the best approach is range trading. Buy near support, sell near resistance, and avoid overtrading. In this phase, capital protection is more important than aggressive gains.
Momentum and Volume Truth
Real moves are never weak. A true breakout comes with strong candles, increasing volume, and minimal rejection. If price moves slowly or without energy, it is usually a trap.
The same applies to downside moves. A sharp drop shows intent, while a slow decline shows uncertainty. Recognizing this difference helps you avoid low-quality trades and focus only on high-probability setups.
Intermarket Alignment
Bitcoin leads the market, but Ethereum and Solana confirm direction. When Bitcoin holds strong and Ethereum starts pushing higher, it signals hidden bullish momentum. If Solana follows, it confirms that risk appetite is increasing.
If Bitcoin weakens and altcoins drop faster, it shows a defensive market. Watching this relationship gives you early signals before the big move happens.
Psychology: The Real Battle
This phase is not testing your strategy. It is testing your discipline.
Most traders lose here because they: Overtrade out of boredom
Enter without confirmation
Exit due to fear
Professionals do the opposite. They wait, stay calm, and act only when the setup is clear. The ability to do nothing is a powerful skill in trading.
Risk Management
No setup is guaranteed. That is why risk management is everything. Define your risk before entering any trade. Keep losses small and controlled. Avoid overexposure in uncertain conditions.
In a compressed market, volatility can expand suddenly. Without proper risk control, one bad trade can wipe out multiple gains.
Final Insight
The market is building pressure. This phase will not last forever. When the move comes, it will be fast and aggressive.
Most traders will miss it because they will act too early or react emotionally. A small percentage will capture it because they stayed patient, waited for confirmation, and executed with precision.
This is not just a quiet market phase. This is the setup before the next big move. The opportunity will come, but only for those who are prepared, disciplined, and ready to act at the right moment.
repost-content-media
  • Reward
  • 7
  • Repost
  • Share
Luna_Star:
Buy To Earn 💰️
View More
#USSeeksStrategicBitcoinReserve US Strategic Bitcoin Reserve Narrative The Emerging Concept of a Sovereign Bitcoin Reserve The idea of a US Strategic Bitcoin Reserve represents a potential turning point in global finance where Bitcoin moves from a speculative asset into a sovereign-level reserve instrument. This means Bitcoin could be treated in a similar way to gold or foreign exchange reserves, which governments hold to stabilize economies and manage financial crises. At present, Bitcoin is trading around $78,660, after recently fluctuating within a tight consolidation range of approximat
BTC-0.07%
ETH0.37%
HighAmbition
#USSeeksStrategicBitcoinReserve
US Strategic Bitcoin Reserve Narrative
The Emerging Concept of a Sovereign Bitcoin Reserve
The idea of a US Strategic Bitcoin Reserve represents a potential turning point in global finance where Bitcoin moves from a speculative asset into a sovereign-level reserve instrument. This means Bitcoin could be treated in a similar way to gold or foreign exchange reserves, which governments hold to stabilize economies and manage financial crises.
At present, Bitcoin is trading around $78,660, after recently fluctuating within a tight consolidation range of approximately 3% to 5% intraday movement. Ethereum is holding near $2,315, also showing similar compression of around 4% to 6% across recent sessions. This synchronized stability suggests that the entire crypto market is currently in a controlled accumulation phase rather than a distribution phase.
Understanding Strategic Reserves in Modern Finance
A strategic reserve is a financial buffer held by governments to protect against economic instability, inflation shocks, geopolitical risks, or currency volatility. Traditionally, this includes gold reserves, foreign currency reserves, and energy reserves.
If Bitcoin becomes part of this structure, it means governments are acknowledging it as a long-term macroeconomic asset rather than just a trading instrument. This would represent a structural upgrade in how digital assets are treated globally.
Bitcoin as Digital Gold with Measurable Market Impact
Bitcoin has a fixed supply of 21 million coins, with approximately 20.02 million already in circulation. This creates a scarcity model that is fundamentally different from fiat currencies, which can expand through monetary policy.
From a price behavior perspective, Bitcoin has historically moved in cycles where consolidation phases of 2% to 6% volatility often lead to expansion moves of 8% to 20% once breakout direction is confirmed. Current structure fits this pattern, indicating potential for strong directional movement ahead.
If Bitcoin becomes a recognized reserve asset, long-term demand pressure could increase significantly, potentially driving structural price appreciation of 15% to 40% over extended macro cycles due to supply constraints and institutional accumulation.
Current Market Context and Price Behavior
Bitcoin at $78,660 is currently in a decision zone. The nearest resistance level is psychologically strong around $80,000, representing a key breakout threshold. A successful breakout above this level with volume could trigger an initial upside expansion of approximately 4% to 8%, targeting the $82,500 to $85,000 range in the short term.
On the downside, if Bitcoin fails to hold current support and breaks below the $76,800 zone, a corrective move of approximately 3% to 6% could occur, potentially retesting $74,000 to $72,500 levels before stabilization.
Ethereum at $2,315 is also compressed within a similar structure. A breakout above $2,380 could result in a 3% to 6% upward move toward $2,450 to $2,550, while a breakdown below $2,200 could trigger a 4% to 7% decline toward $2,050 levels.
These percentage ranges show that the market is currently in a low-volatility phase, which historically precedes high-volatility expansion phases.
Institutional and Sovereign Impact on Price Structure
If the United States or any major economy begins accumulating Bitcoin as part of a strategic reserve, the market structure would shift significantly.
Institutional inflows could increase demand by billions or even trillions of dollars over time. Given Bitcoin’s limited supply, even small percentage increases in long-term holding behavior can create strong upward pressure on price.
For example, if sovereign demand reduces circulating liquidity by even 5% to 10%, historical models suggest potential long-term price expansion of 20% to 50% depending on macro conditions and market cycle stage.
This is because Bitcoin operates on a fixed supply model, meaning demand shocks have a direct and amplified effect on price.
Market Reaction and Volatility Behavior
Markets tend to react aggressively to strategic narratives before actual implementation occurs. When Bitcoin reserve discussions intensify, short-term volatility often increases within a range of 5% to 12% due to speculation and positioning shifts.
However, once clarity emerges, volatility typically stabilizes while price trends strengthen in one direction. This transition from uncertainty to structured demand is what creates long-term upward cycles.
In this environment, traders often see fake breakouts and liquidity sweeps of 2% to 5% before the real move begins. These are structural repositioning phases where the market prepares for directional expansion.
Long-Term Price Potential with Percentage Projections
If Bitcoin gradually transitions into a globally recognized reserve asset, long-term price projections can be divided into multiple phases:
Short to Mid-Term (2026–2028)
Potential range expansion between 90,000 and 150,000 USD, representing a 15% to 90% increase from current levels depending on macro liquidity conditions.
Long-Term Structural Phase (2028–2035)
If adoption accelerates, Bitcoin could experience cumulative growth of 200% to 500% over extended cycles, driven by institutional and sovereign accumulation.
Extreme Bull Case Scenarios
In highly aggressive adoption models where Bitcoin becomes a core global reserve asset, long-term appreciation could exceed 1,000% over multiple cycles, although this depends on global regulatory alignment and macroeconomic transformation.
These projections are not linear but cyclical, meaning Bitcoin will continue to experience corrections of 20% to 50% even within long-term bullish structures.
Macroeconomic Shift and Global Financial Redesign
The introduction of Bitcoin into sovereign reserves would represent a shift from traditional fiat-dominated systems to hybrid financial architecture.
In this model, fiat currencies, gold, and Bitcoin would coexist as layered reserve instruments. Bitcoin would act as a hedge against inflation and currency devaluation while also serving as a geopolitical neutral asset.
This could lead to increased global diversification where countries allocate even 1% to 5% of reserves into Bitcoin, which alone would represent massive capital inflows relative to current market capitalization.
Final Structural Insight
Bitcoin at $78,660 and Ethereum at $2,315 are currently not in a trend phase but in a controlled compression phase with approximately 3% to 6% volatility range. Historically, such conditions precede major expansion moves of 8% to 20% or more depending on liquidity direction.
The US Strategic Bitcoin Reserve narrative adds a macro layer that could significantly increase long-term demand expectations, potentially shifting Bitcoin’s price structure into a higher valuation regime over time.
The key takeaway is simple: the market is not only reacting to current price movement of 2% to 5% ranges, but also pricing in a potential future where Bitcoin becomes part of global sovereign financial infrastructure.
This is not just a trading narrative. It is a structural transformation of global money systems where percentage-based volatility today may represent the foundation of much larger macro expansion cycles in the future.
repost-content-media
  • Reward
  • 7
  • Repost
  • Share
Luna_Star:
Diamond Hands 💎
View More
#GateSquareMayTradingShare Global Liquidity Crunch 2026 The global financial system in 2026 is operating under a prolonged liquidity compression phase where capital flow is restricted, borrowing costs remain elevated, and risk appetite is structurally reduced. This does not mean money is absent from the system; instead, it is circulating slowly, selectively, and with strong preference for low-risk assets. In this environment, crypto markets act as a real-time reflection of global liquidity stress, reacting faster and sharper than traditional financial instruments. Current Crypto Market St
BTC-0.07%
ETH0.37%
HighAmbition
#GateSquareMayTradingShare
Global Liquidity Crunch 2026
The global financial system in 2026 is operating under a prolonged liquidity compression phase where capital flow is restricted, borrowing costs remain elevated, and risk appetite is structurally reduced. This does not mean money is absent from the system; instead, it is circulating slowly, selectively, and with strong preference for low-risk assets. In this environment, crypto markets act as a real-time reflection of global liquidity stress, reacting faster and sharper than traditional financial instruments.
Current Crypto Market Structure and Prices
Bitcoin (BTC) is trading in the approximate range of $78,000 to $81,000. Daily movements are typically within 1% to 3%, but macro-driven volatility events can trigger 5% to 8% intraday swings. In strong liquidity shocks, Bitcoin has the potential to temporarily move 8% to 12% within short timeframes due to leveraged positioning and thin liquidity pockets.
Ethereum (ETH) is currently moving around $2,250 to $2,450. Ethereum shows higher beta behavior compared to Bitcoin, meaning its percentage moves are more amplified. Normal daily volatility ranges between 2% to 4%, while macro reactions can push 5% to 10% swings, especially when liquidity expectations shift or ETF inflows/outflows change.
Altcoins in general remain highly sensitive. Large-cap altcoins typically move 5% to 12% in trending sessions, while mid and low-cap assets can experience 10% to 25% intraday swings. However, these moves are often liquidity-driven spikes rather than sustained directional trends due to the absence of strong capital rotation.
Bitcoin Dominance and Market Structure
Bitcoin dominance is currently elevated in the range of approximately 60% to 62%. This reflects strong capital concentration in Bitcoin as the “safest” crypto asset during liquidity tightening. Historically, when dominance is above 60%, altcoins underperform or remain range-bound.
A decline in dominance below 55% would typically signal the beginning of altcoin rotation cycles, which in previous market phases have led to 20% to 100%+ gains in selected altcoin sectors. Until such a shift occurs, capital remains locked in Bitcoin accumulation zones.
Primary Liquidity Drivers and Percentage Market Impact
US Dollar Strength (DXY Impact) The US Dollar Index is trading near 98 to 100 levels. A strong dollar generally leads to 3% to 8% downside pressure in Bitcoin over short cycles due to global capital tightening. When DXY rises further, emerging market and crypto liquidity contracts, reducing speculative inflows.
US Treasury Yields Effect Even a 0.25% to 0.50% increase in yields can trigger 2% to 6% reallocation pressure from crypto into bonds and fixed income instruments. This creates hidden liquidity drains that do not appear as immediate crashes but rather slow compression phases.
Oil Prices and Inflation Pressure Crude oil trading above $100 per barrel (WTI around $102–$105 and Brent above $108–$110 in recent cycles) adds persistent inflation pressure. This reduces global liquidity availability and indirectly contributes to 3% to 7% downside pressure in risk assets during tightening phases.
Crypto Volatility Structure in Liquidity Crunch
Bitcoin: Normal range: ±1% to 3% daily Macro events: ±5% to 8% Stress conditions: up to ±10% intraday spikes
Ethereum: Normal range: ±2% to 4% Macro events: ±5% to 10% High volatility phases: up to ±12%
Altcoins: Large caps: ±5% to 12% Mid caps: ±10% to 20% Low caps: ±15% to 30%+
These percentages show that crypto is not moving randomly but is structurally reacting to liquidity conditions.
Stablecoin Liquidity Behavior
Stablecoin supply continues to expand gradually, but deployment speed is low. This means capital is sitting in reserve rather than entering risk markets. In bullish expansion cycles, stablecoin inflows into crypto can increase market capitalization by 20% to 50% in short bursts. In contrast, during liquidity crunch phases, stablecoins accumulate without triggering immediate price expansion.
Institutional Flow and ETF Impact
Bitcoin ETFs have introduced structural inflows estimated in the range of 0.5% to 2% weekly impact on market liquidity during active phases. However, this flow is not fully elastic. During macro uncertainty, ETF inflows slow significantly, reducing upward momentum even if long-term demand remains intact.
Ethereum ETFs and institutional interest add an estimated 3% to 6% support effect during positive liquidity phases, but this is currently offset by macro tightening.
Macro Compression vs Expansion Dynamics
The current market is in a compression phase rather than a distribution or collapse phase. Compression phases typically reduce volatility by 20% to 40% compared to expansion cycles. Spot volume decline in Bitcoin and Ethereum further confirms this structural tightening.
Historically, such phases precede expansion cycles where assets move 50% to 150%+ over medium-term horizons once liquidity conditions reverse.
Key Support and Resistance Zones with Percentage Relevance
Bitcoin: Support zones: $73,000 to $75,000 (approx. -5% to -8% downside buffer from current range) Resistance zones: $80,000 to $85,000 (approx. +2% to +8% breakout range)
Ethereum: Support zones: $2,100 to $2,200 (approx. -5% to -10% downside buffer) Resistance zones: $2,500 to $3,000 (approx. +8% to +25% breakout potential)
Breakouts above these resistance levels typically require synchronized liquidity expansion, not just internal crypto momentum.
Market Psychology and Sentiment Spread
Retail sentiment is currently divided between two psychological extremes. One side expects immediate breakout continuation based on historical halving cycles and ETF adoption. The other side expects prolonged stagnation due to macro tightening. This divergence leads to short-term trading dominance, where quick 2% to 5% trades are preferred over long-term positioning.
Smart money behavior, however, suggests accumulation during low volatility phases, particularly when sentiment is uncertain.
Long-Term Liquidity Outlook
Historically, liquidity crunch phases do not end with gradual improvement; they end with sharp expansion shifts. When central banks pivot or global liquidity returns, markets that are compressed often experience rapid revaluation.
In previous cycles, Bitcoin has delivered 50% to 120%+ upside moves in post-compression phases, while Ethereum and altcoins have delivered even higher percentage expansions depending on liquidity rotation speed.
Conclusion
The Global Liquidity Crunch 2026 is not a breakdown phase but a structural reset phase. Prices are compressed, volatility is controlled, and capital is waiting rather than exiting. Bitcoin, Ethereum, and altcoins are all reflecting different layers of the same macro liquidity environment.
Bitcoin remains the primary liquidity barometer with 3% to 8% reaction sensitivity. Ethereum reflects higher beta with 5% to 10% swings. Altcoins remain the most sensitive with up to 30% volatility during liquidity spikes.
The key takeaway is that this is a positioning phase, not an exit phase. When liquidity conditions shift, percentage moves will expand rapidly, and today’s compressed ranges may transform into tomorrow’s breakout structures across the entire crypto market.
repost-content-media
  • Reward
  • 6
  • Repost
  • Share
Luna_Star:
LFG 🔥
View More
#Gate广场五月交易分享 After the Bitcoin halving, the supply and demand landscape is being reshaped. Are institutional funds now in control? 1. Core Event: The Fourth Halving Comes to Pass, Entering a New Phase in the Cycle On April 20, 2024, the Bitcoin network completed its fourth block reward halving, reducing the block reward from 6.25 BTC to 3.125 BTC. The daily new supply decreased from approximately 900 BTC to about 450 BTC, and the annual inflation rate officially fell below 1% (to 0.85%), making it one of the lowest inflation assets globally. Looking back at the price performance after the p
BTC-0.07%
Ryakpanda
#Gate广场五月交易分享 After the Bitcoin halving, the supply and demand landscape is being reshaped. Are institutional funds now in control?
1. Core Event: The Fourth Halving Comes to Pass, Entering a New Phase in the Cycle
On April 20, 2024, the Bitcoin network completed its fourth block reward halving, reducing the block reward from 6.25 BTC to 3.125 BTC. The daily new supply decreased from approximately 900 BTC to about 450 BTC, and the annual inflation rate officially fell below 1% (to 0.85%), making it one of the lowest inflation assets globally.
Looking back at the price performance after the previous three halvings:
• 2012 first halving: subsequent 12-month increase of about 100 times
• 2016 second halving: subsequent 12-month increase of about 30 times
• 2020 third halving: subsequent 12-month increase of about 7 times
Unlike the previous three, the core feature of this halving is that institutional funds have become the absolute dominant force, with retail investor share continuously declining, market volatility significantly reduced, and the cycle logic shifting from "pure speculation" to "macro asset allocation."
As of April 2026, institutions hold approximately 24%-28% of the circulating BTC supply, up about 17 percentage points from the 2020 halving.
2. Supply and Demand Landscape: Rigid Supply Contraction, Structural Demand Explosion
1. Supply Side: Further Strengthening of Absolute Scarcity
After the halving, the annual new supply of Bitcoin is only about 164k coins, while the global annual gold supply is about 3,000 tons (corresponding to a market value of approximately $1.8 trillion). Bitcoin’s scarcity has far surpassed gold. Bloomberg Industry Research estimates that if current demand growth continues, the supply-demand gap in 2026 will reach 100k–120k BTC, the highest in history. More importantly, the selling pressure from long-term holders (holding for over a year) continues to decrease. As of April 25, long-term holder addresses account for 74%-76% of the total, a record high, and net outflows over the past 30 days are only about 12k BTC, far below the average after previous halvings, indicating a significant increase in market consensus on long-term value.
2. Demand Side: Three Major Inflows of Capital
• Spot ETF Funds: Since the launch of the US Bitcoin spot ETF in January 2025, net inflows have exceeded $78–85 billion, with BlackRock’s iBIT product alone seeing net inflows over $40–42 billion. In the first week after the halving, daily net inflows peaked at $1.6–1.87 billion, a record high.
• Sovereign Funds and Pensions: By Q1 2026, 15–17 sovereign funds and 20–23 large pension funds have allocated BTC, with total holdings exceeding $11–12 billion. The Canada Pension Plan (CPP) holds $2.8 billion, becoming the first national pension fund to make large-scale BTC allocations.
• Corporate Treasuries: Besides Tesla and MicroStrategy, by 2026, 30–32 S&P 500 companies have included BTC on their balance sheets, with total holdings over $14–15 billion. Corporate allocations have shifted from "occasional attempts" to "widespread acceptance."
3. Institutional Consensus: BTC Becomes a Standard in Macro Asset Allocation
A Bloomberg survey of 120 major global asset management firms shows that 62%-68% have incorporated BTC into their portfolios, a 32 percentage point increase from early 2025; among them, 42%-45% allocate 1%-3%, and 10%-12% allocate over 5%.
The core logic widely recognized by institutions:
1. Inflation Hedge Property: In the context of persistent global central bank easing and fiat currency devaluation, BTC’s fixed supply makes it one of the best inflation hedges.
2. Low Correlation: BTC’s correlation with US stocks and US bonds has remained below 0.3 for a long time, effectively diversifying traditional investment risks.
3. Liquidity Improvement: The launch of spot ETFs has significantly enhanced BTC’s liquidity, with bid-ask spreads decreasing from 0.5% in 2020 to 0.05% now, approaching the liquidity levels of mainstream stocks. Goldman Sachs’s latest research report states that if the global asset management industry allocates 1% of assets to BTC, the market cap would reach $3.5 trillion, about 70% higher than current levels; increasing the allocation to 3% could push the market cap beyond $10 trillion.
4. Macro Environment: Rate Cut Expectations Delayed, Liquidity Still Favorable
The current macro environment remains friendly to BTC, but the Federal Reserve has not entered a rate-cut cycle. At the March FOMC meeting, the Fed maintained the federal funds rate at 3.50%–3.75%, with no rate cuts, and due to Middle East conflicts and rising oil prices, rate cut expectations have been significantly postponed. The market currently expects at most one rate cut in 2026 (by 25 basis points), likely in the second half of the year, rather than the 3–4 cuts initially forecasted. Although a rate-cut cycle has not yet begun, liquidity remains ample, and real interest rates have not tightened further, which continues to benefit risk assets and cryptocurrencies.
Historical patterns show that rising rate cut expectations often benefit BTC more than actual rate cuts. The market is currently pricing in "possible rate cuts in the second half," combined with a weakening dollar, which continues to benefit BTC priced in USD. Additionally, uncertainties around the US presidential election are boosting safe-haven demand. If policies stabilize and regulatory frameworks become clearer, it will further support BTC’s role as an alternative asset.
The fourth halving of Bitcoin marks the beginning of a new phase in its cycle. The rigid contraction of supply and the structural explosion of demand create a strong supply-demand gap, while ongoing institutional inflows are reshaping market valuation systems.
In the short term, BTC may fluctuate between $70,000 and $90,000 to digest profit-taking after the halving; in the medium to long term, with increasing institutional allocations and further macroeconomic easing, BTC is expected to break through $100k by the end of 2026 and reach $150,000 in 2027.
For investors, BTC is no longer a high-risk speculative asset but an important component of macro asset allocation.
repost-content-media
  • Reward
  • 7
  • Repost
  • Share
Luna_Star:
Ape In 🚀
View More
  • Pin